
Multi-iSheet sources
You can display charts with data pulled from multiple iSheet sources. This means you can create data visualisation charts using data from multiple iSheets from multiple sites.
Creating a Multi-iSheet source
To create a multi-iSheet source, select
Admin
.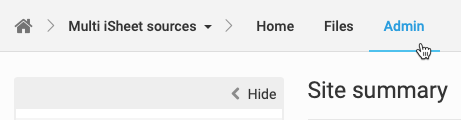
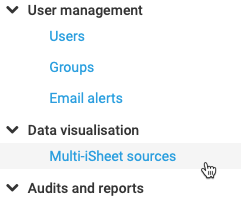
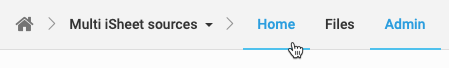
In admin, navigate to
Data visualisation
> Multi-iSheet sources
.
The
Multi-iSheet sources
screen opens.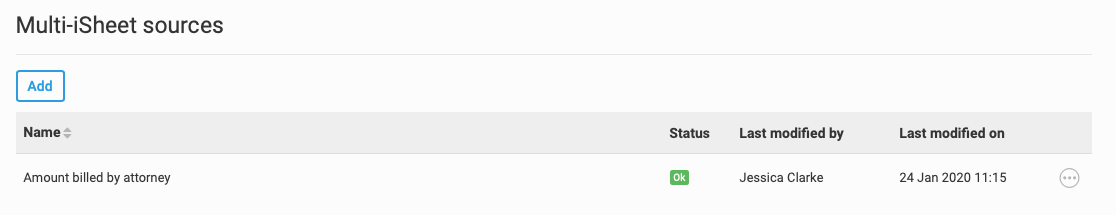
You can
Add
new multi-iSheet sources, Edit
or Remove
existing multi-iSheet sources, and also check on the Status
, Last modified by
and Last modified on
data.Adding a new multi-iSheet source
To add a new multi-iSheet source, select
Add
.
The
Add source
screen opens.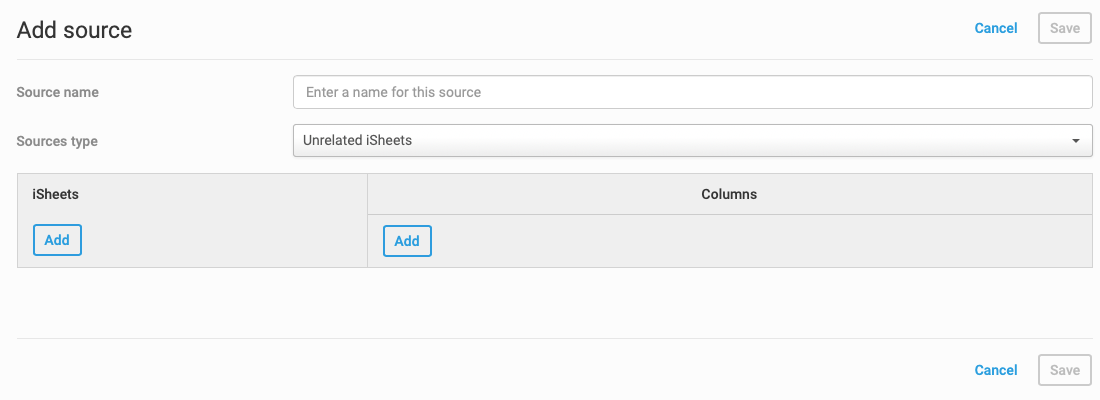
Give the new source a
Name
. Additionally, you must select the Source type
from the drop-down menu.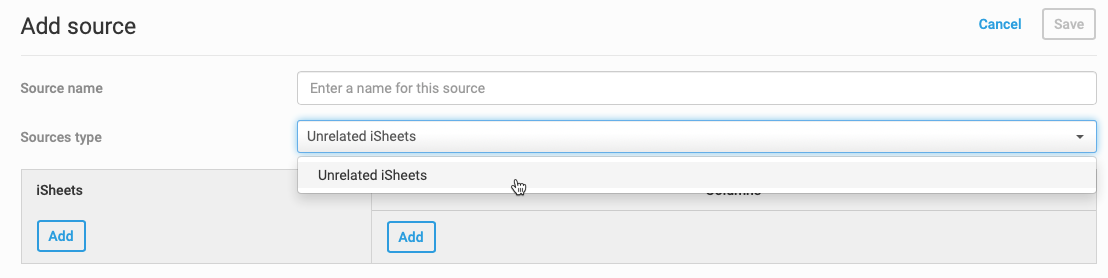
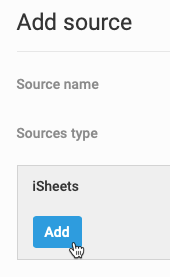
Once you have given the new source a name and selected the source type, select the source iSheet for data. To do so, within the iSheets section, select
Add
.
The
Select iSheets
screen opens, showing all available iSheets which you have access to.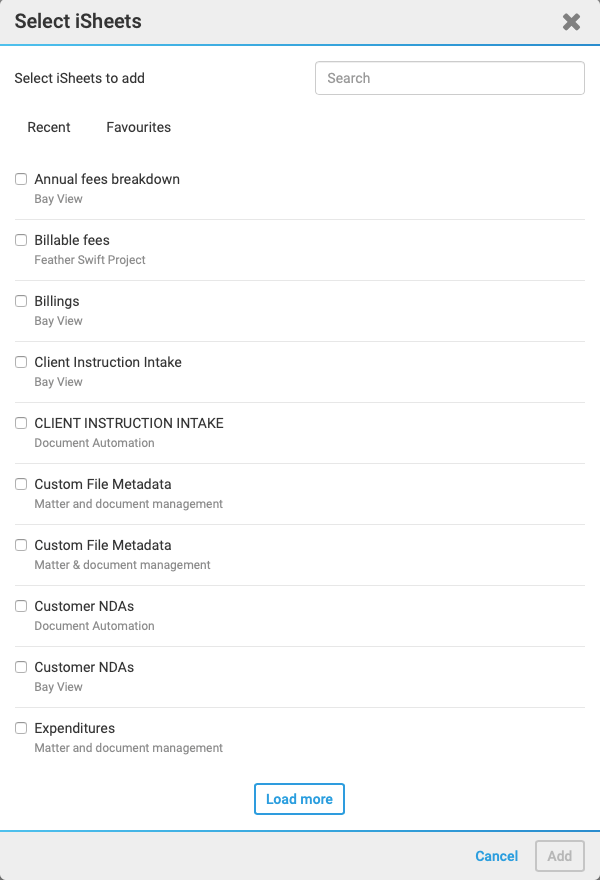
You can also search for a specific iSheet or filter by Recent or Favourites.
note
Please note that each iSheet and also which site the iSheet belongs to is displayed here.
Select the iSheets you wish to use for your multi-iSheet source and select
Add
. note
There is currently a limit of 12 iSheets for performance reasons, but if you wish to discuss using more iSheets, please contact support.
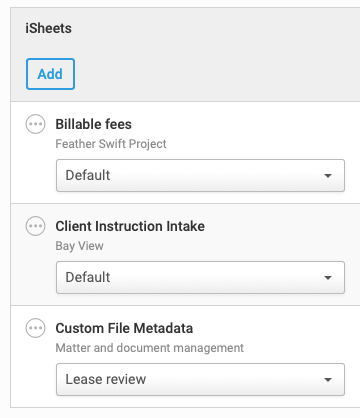
These iSheets are displayed.
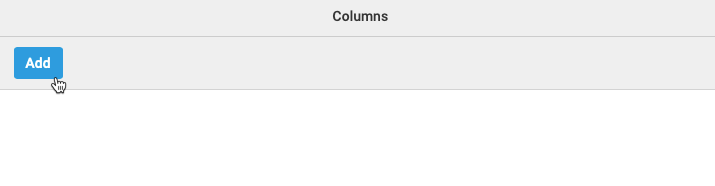
Now you have selected the iSheets, we need to select the columns. To do so, within the
Column
section, select Add
.
This displays new drop-down fields, for each iSheet.
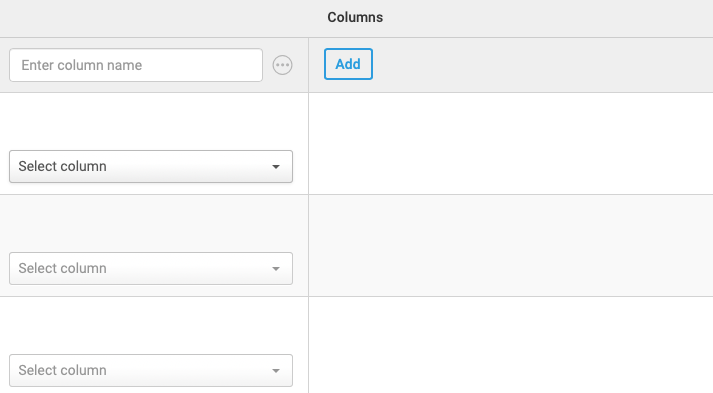
note
There is currently a limit of 6 columns for performance reasons, but if you wish to discuss using more columns, please contact support.
note
The data selected in the first row of this section defines the data available in each drop-down menu.
Select which data you wish to display from the drop-down menus within the column section.
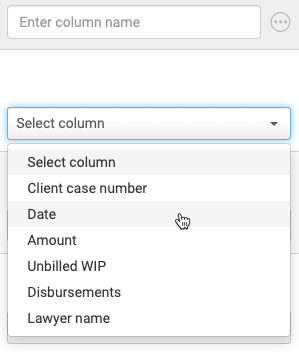
Once you have selected all of this data, select
Save
to save all of your changes.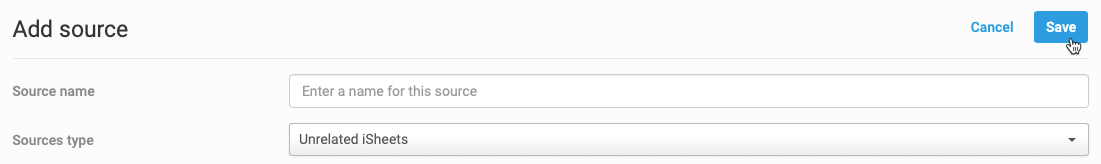
note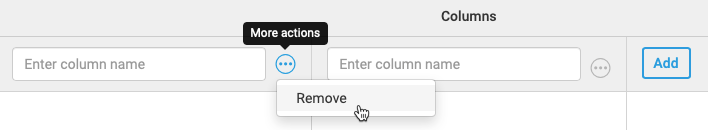
If you would like to remove columns or iSheets once you have selected them, please click
More actions
> Remove
for either of them.Managing Multi-iSheet sources
In the
Multi-iSheet source
screen, you can Edit
and Remove
existing sources, and also check the Status
, see who last modified a source and see the date a source was last modified.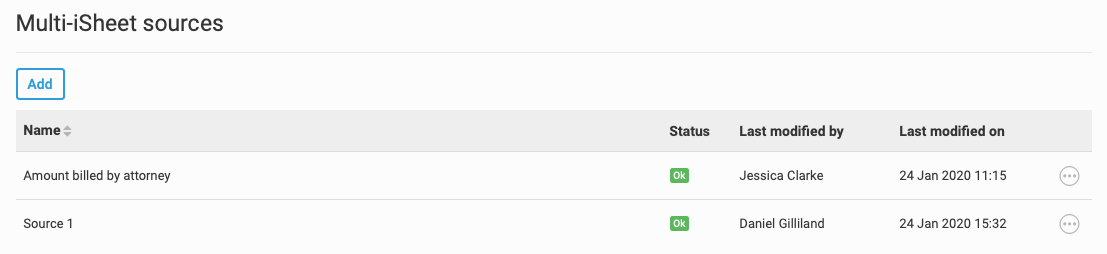
- Edit- ClickMore actions>Editto edit the source
- Remove- ClickMore actions>Editto remove the source
- Status- This is the status of the source. OK means that the source can be used. A warning symbol indicates that there is an error that needs to be rectified
- Last modified by- This is who last modified this source
- Last modified on- This is the last date the source was modified on
Displaying data visualisation charts from Multi-iSheet sources
Once you have created your Multi-iSheet source, you can use it to display data in charts. To do this, navigate to any site home page.
Click the
Edit
button to Add
content.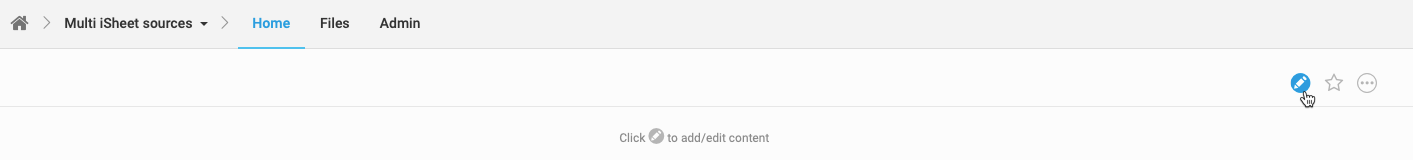
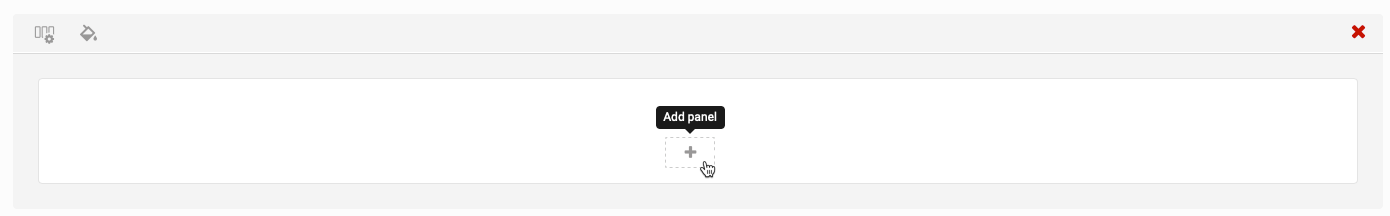
Select
Add panel
.
And select
Data visualisation
within the Add panel
screen.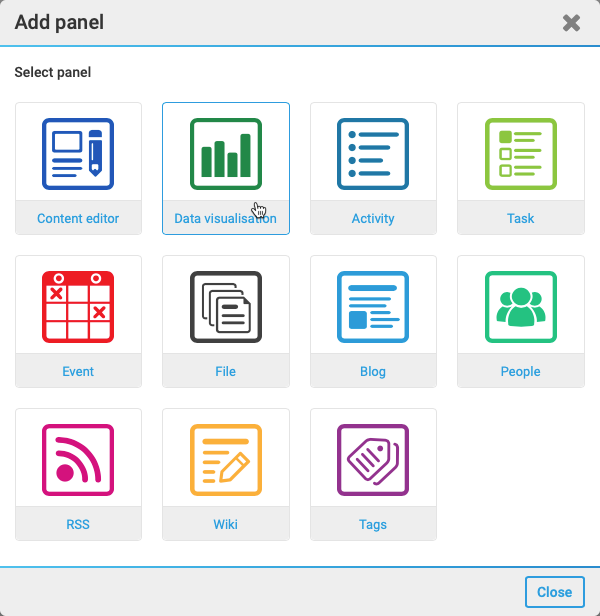
Once you have familiarised yourself with data visualisation, give your new panel a
Title
and select Multi-iSheet source
as your source.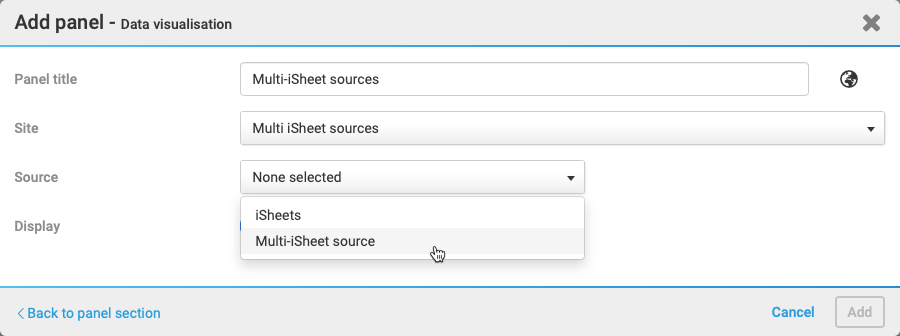
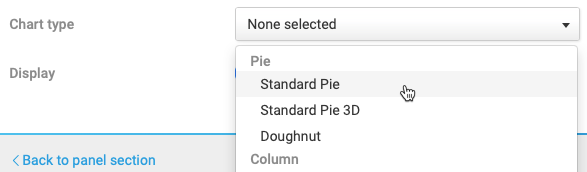
Select the
Chart type
.
And then select the
Category
, Value
and Filter
data values.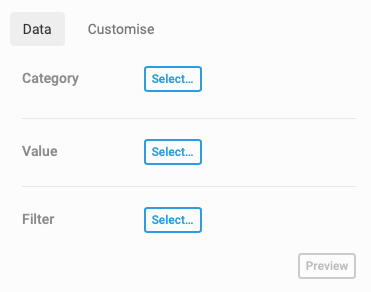
Once you have selected these data values, select
Preview
. If you are happy with your chart, select Add
to add your chart to the home page.Retrieve all Multi-iSheet charts data
You can retrieve all multi-iSheet chart data so that users can see all aggregate data without needing access to all the sites and iSheets that comprise the source. This means you can share a chart with a user without giving them direct access to the source data.
note
Please note users can only see and drill down into the data if they have the required permissions.
To set these permissions, when adding a new panel, there will be a new
Permissions
section.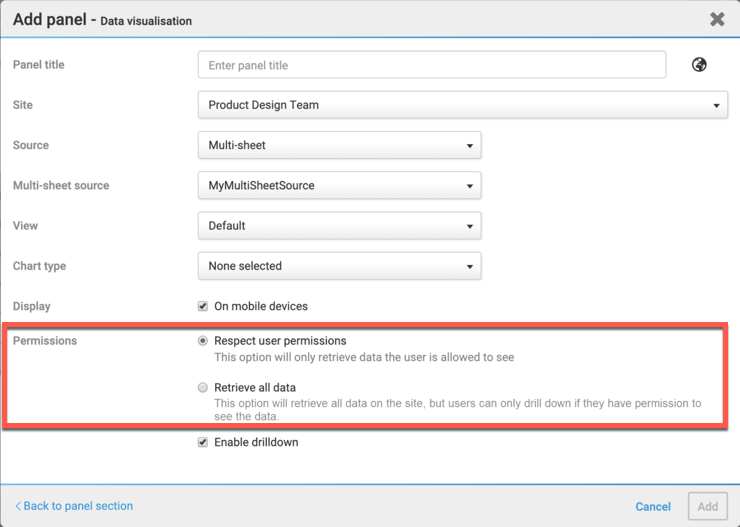
The two options available are:
- Respect user permissions- This option is used to ensure the user will only see the data they are allowed to see
- Retrieve all data- This option enables the user to see all data that is available in that source, regardless of a user's specific permissions
Once you have entered all the details of the panel, select
Add
. The panel will be added with the relevant permissions set.Drilling down to a source
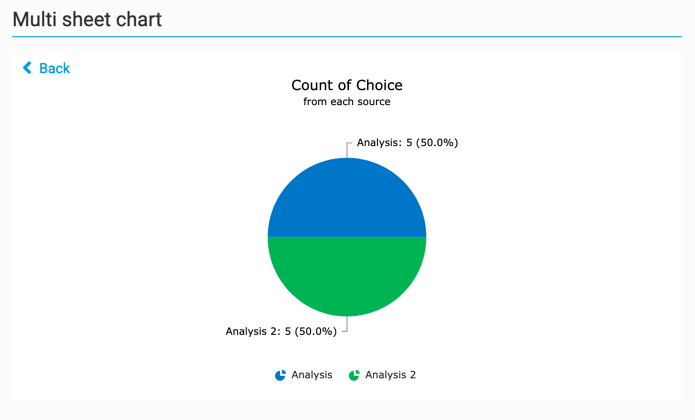
You can, with permission, drill down to the source of a multi-iSheet chart. To do this, on your chart, click one of the segments. A multi-iSheet chart has more than one level of information, so you will have to click multiple times, to get to the source:
note
The first click shows how much each source contributes to the top-level chart. You only see sources you have permission to see, even if the chart has been created to retrieve all data. You can press
Back
to go back to the top-level chart.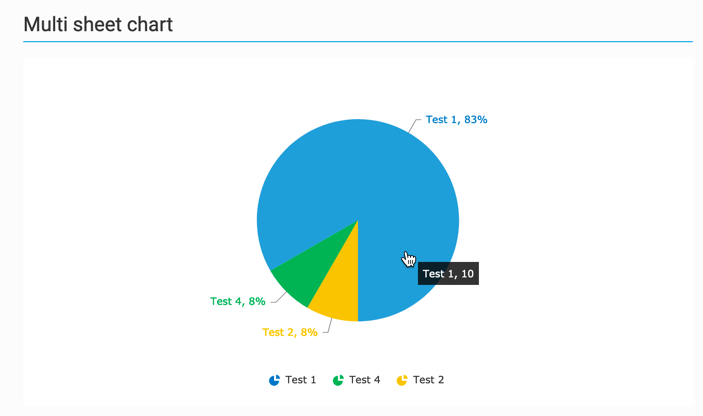
Below is the result of clicking the first chart, showing two sources, each contributing 50% of the total.
note
The title of the chart shows you the type of aggregation (count, average or sum) and the field being aggregated.
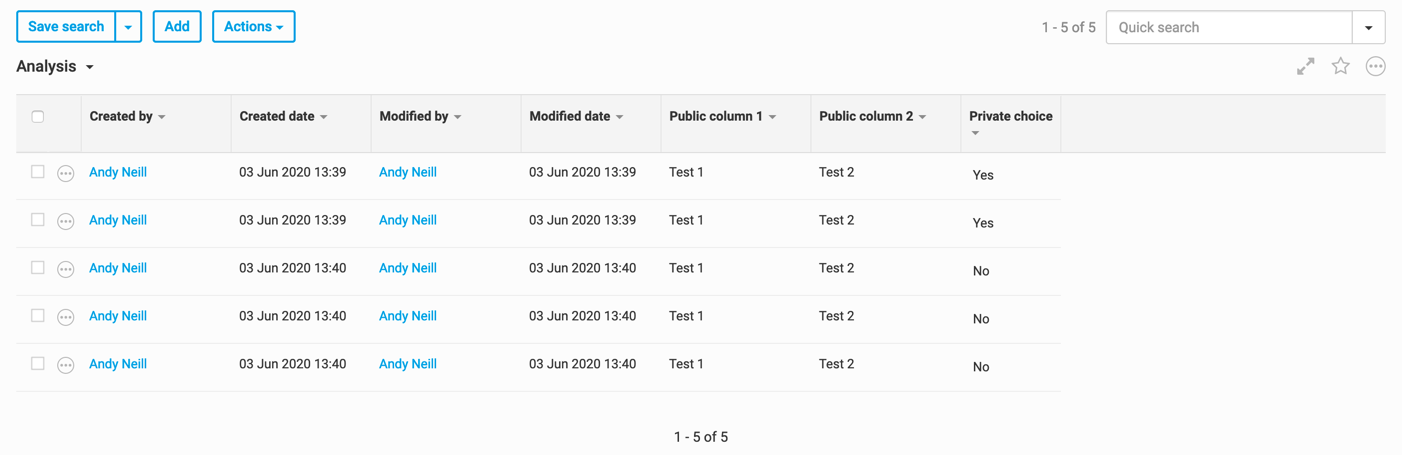
When you click one of the two segments in this chart, you are taken to the selected source.
note
Please note that when you add iSheets to a multi-iSheet source, you cannot search and find iSheets from template sites.
note
Please note, that when an iSheet view has a column removed and that column is used in a multi-iSheet source, the status of that source will be set as Warning. To inform users that there is now an unmapped column. To fix this, edit the source.
note
Users can also search for iSheets based on the site name, as well as the title of the iSheet.
Bypass permissions when displaying data
You can aggregate all data from the source sites, rather than hide the data the user may not have permission to see.
When adding a
Data visualisation
panel, and your source is set as Multi-iSheet, you have the following permissions options.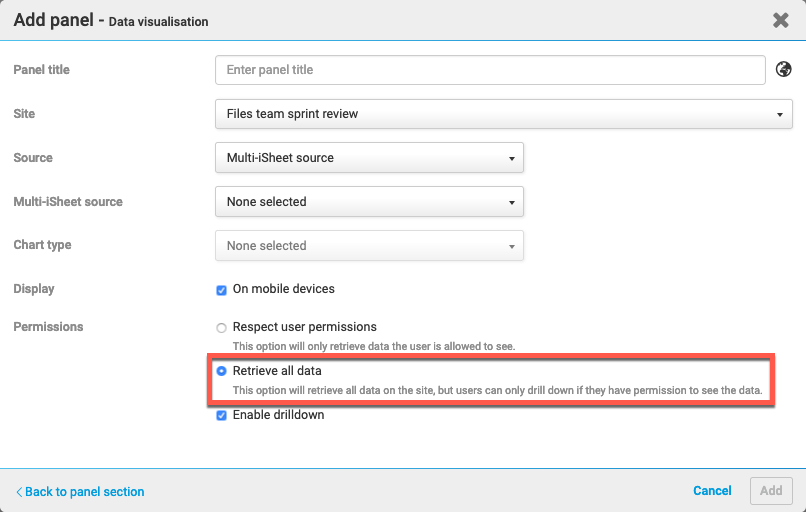
- The newRetrieve all dataoption should be set to ensure that the permissions on the record data are ignored and all records that match any filter are returned from all sources. The user will not be able to drill down into the data of any sites or Sheets that they do not have permission to see
- TheRespect user permissionsoption will only display the data that the user is allowed to see
note
Please note that site security checks are still shown (such as terms and conditions and password etc.), but once they have been passed, the data is collected as if the user is a site administrator.