
Standard Map Panel
Standard Maps are interactive data visualizations that display iSheet data across geographic regions, using colour-coded regions, hover details, and optional table details to help users quickly identify geographic patterns and trends. Multiple maps can be added to a single panel and switched between, making it easier to view the same data from different geographic perspectives.
note
This panel is available only for System-level and Custom Page dashboards and is available to all
HighQ Premium
clients but is not enabled by default. Please get in touch with your Account or Customer Success representative to enable it.Adding a Map panel
To add a Map panel, navigate to your custom page dashboard and select
Edit
dashboard. Click the +
icon, then choose Standard Map
from the Interactive Data Visualization panel options. 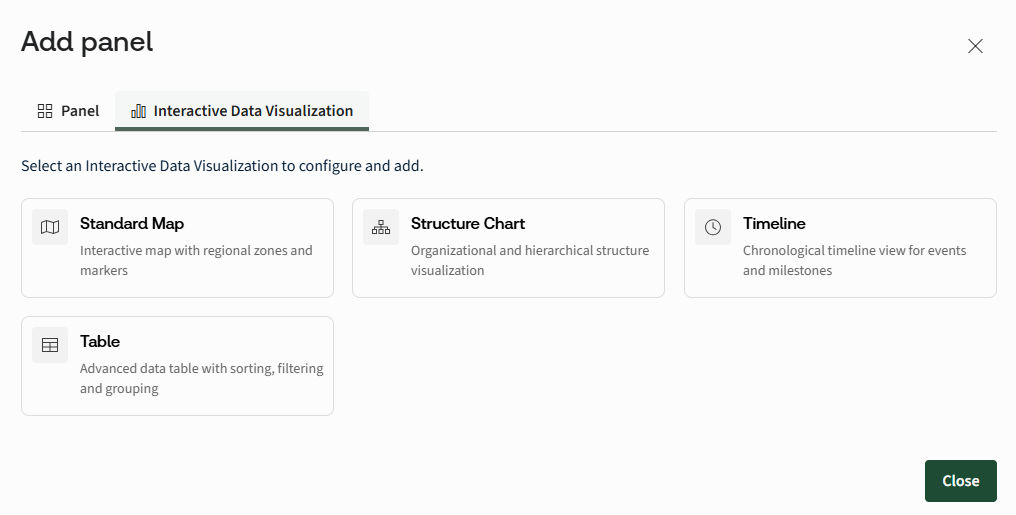
note
You can create up to 20 standard maps per panel.
It is important to note that
using map visualizations with large-scale iSheets can impact dashboard performance during load. For better performance, consider creating separate dashboards for large iSheets and avoid setting them as the default landing dashboard. In the configuration prompt, select the total number of maps to include in the panel (you can include up to a maximum of 20).
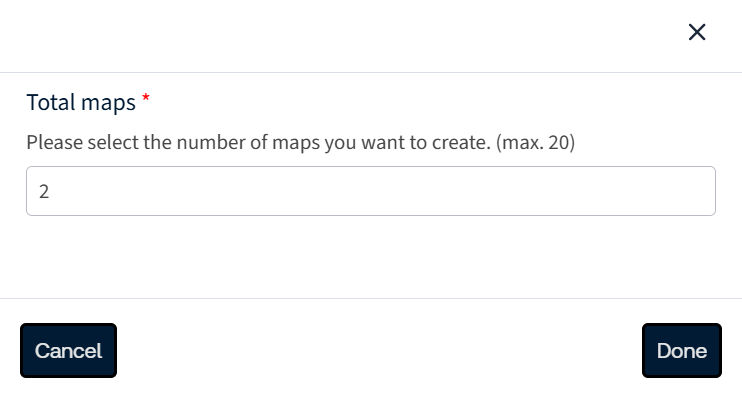
Based on your selection, the configuration modal will open, allowing you to set up each map individually.
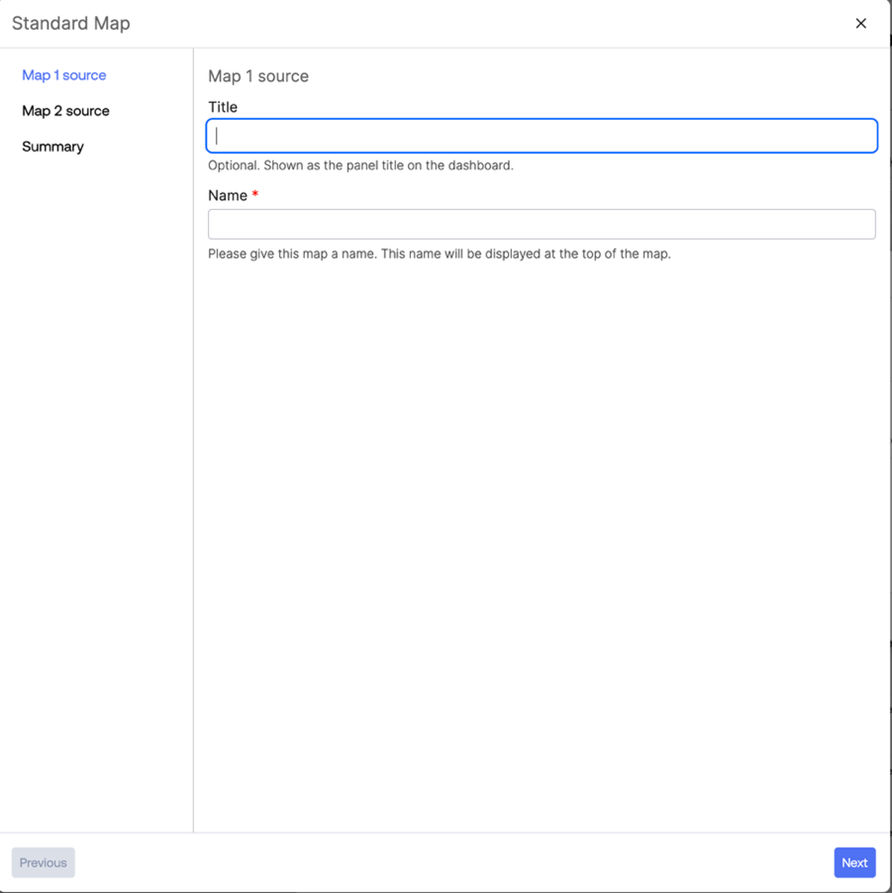
- Title- Enter the name of the panel.
- Map name (required)- Enter the name of the map. This is the label displayed when users switch between multiple maps within the same panel.
Once a Map name is provided, the
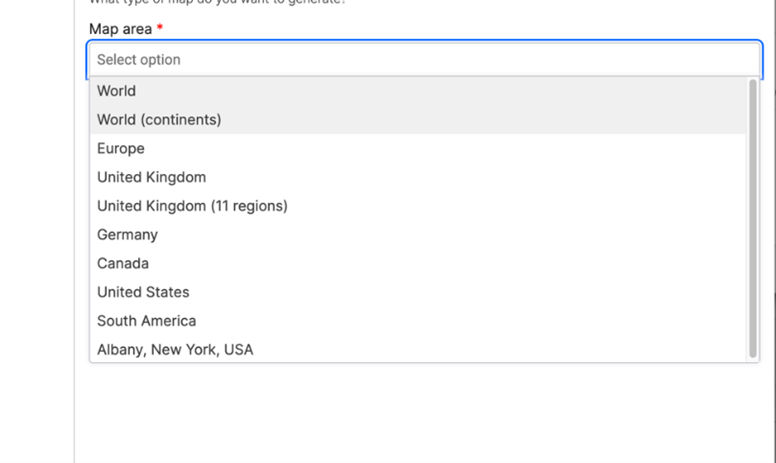
Map type
options become available, and colour-coded regions are displayed for the selected map. 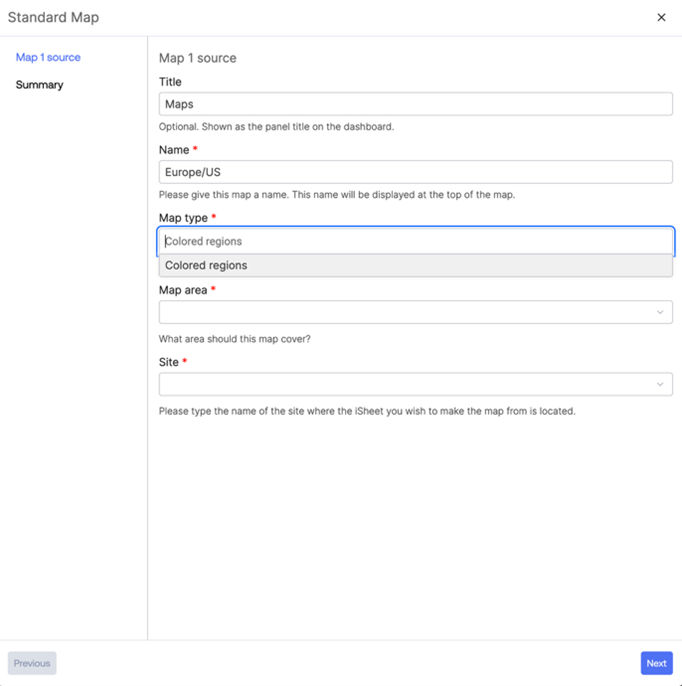
Select a map from the available list in the map area.
Data Source
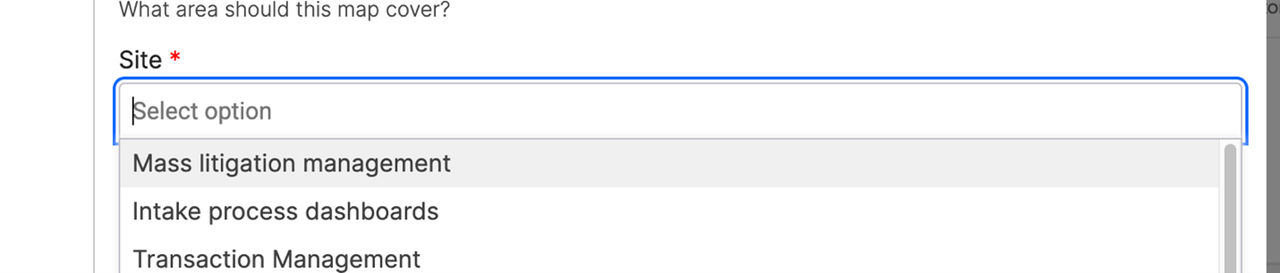
Choose the data source from either a Site or an iSheet.
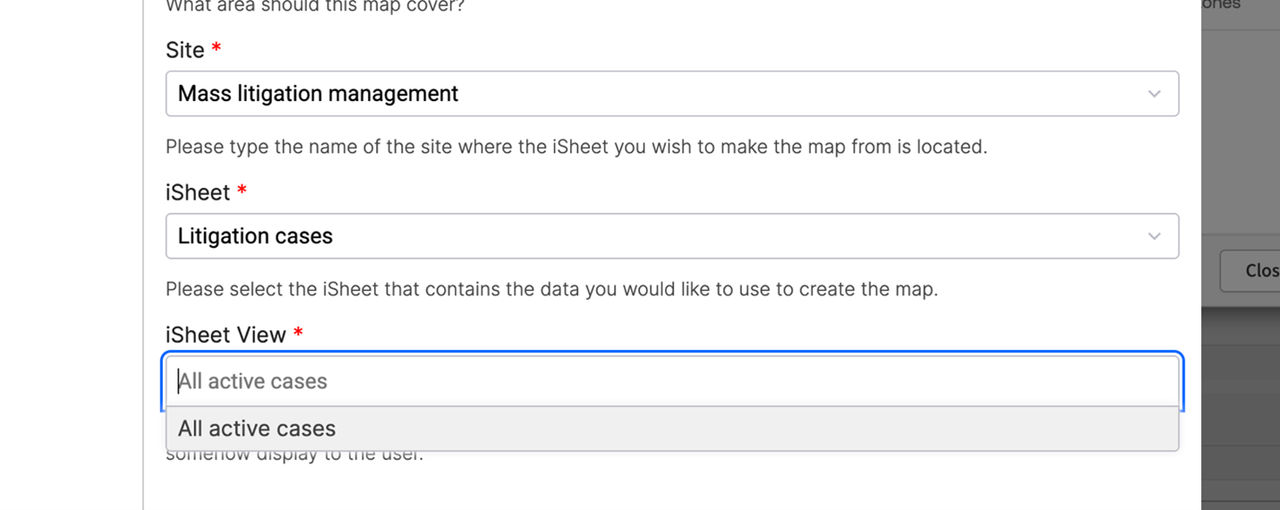
- Site- Choose the site that holds the iSheet data you want to use.
- iSheet- Choose the iSheet and the relevant iSheet view.
note
The map displays data only if the user has at least
view-level access
to the selected iSheet. Click
Next
to continue. Location Mapping
Select a
Location column
. This must be a choice-type column from the selected iSheet. 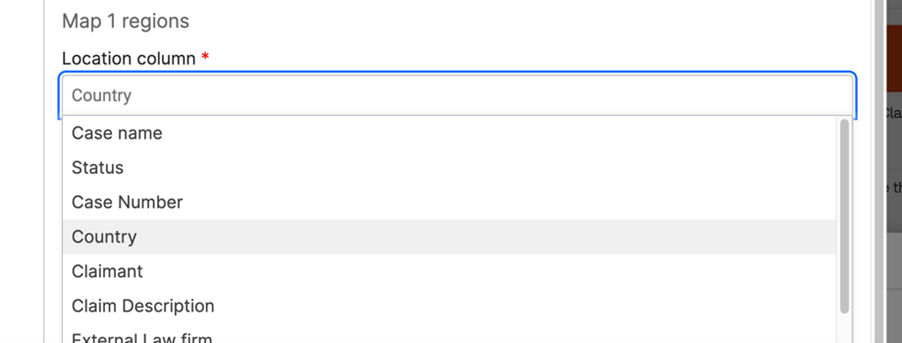
The iSheet values are automatically listed and can be matched to the corresponding regions on the map.
note
If the iSheet values match the default map regions, the mapping is completed automatically.
Custom regions
You can further customise the map by defining custom regions that group multiple built-in sub-regions into a single logical region within the map dashboard. This simplifies how geographic data is displayed and allows you to map iSheet values to the custom region label instead of individual sub-regions. As a result, all included areas are visually combined and shaded together, providing a clearer and more meaningful regional view.
To add a custom region, select
Add custom region
from the regions configuration.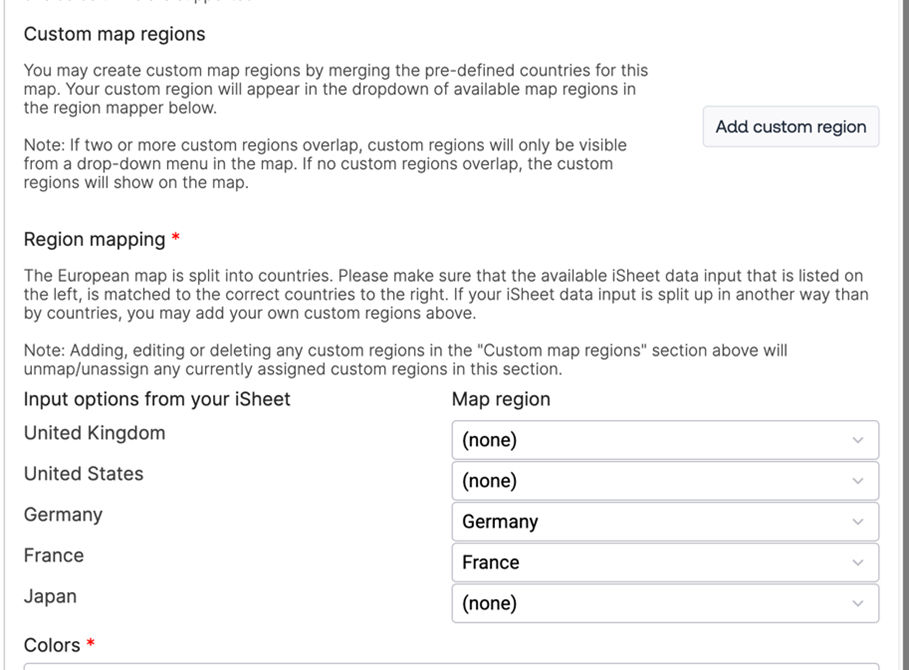
All the included areas are visually combined and shaded together, providing a clearer and more meaningful regional view. Let's say we have a base map,
Europe
, and we define a custom region called Nordics
, which includes Norway, Sweden, Denmark, and Finland as sub-regions. 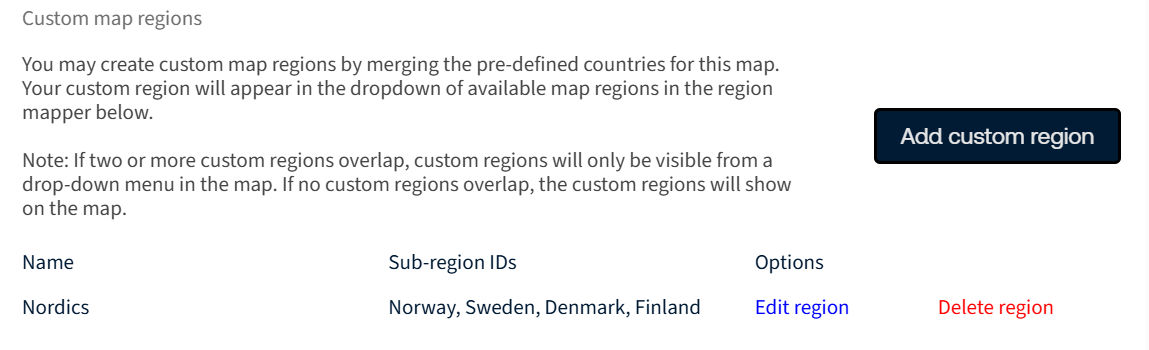
If an
iSheet value
is mapped to Nordics
, the map will treat these countries as a single logical region. As a result, all included countries are shaded together on the map instead of individually. 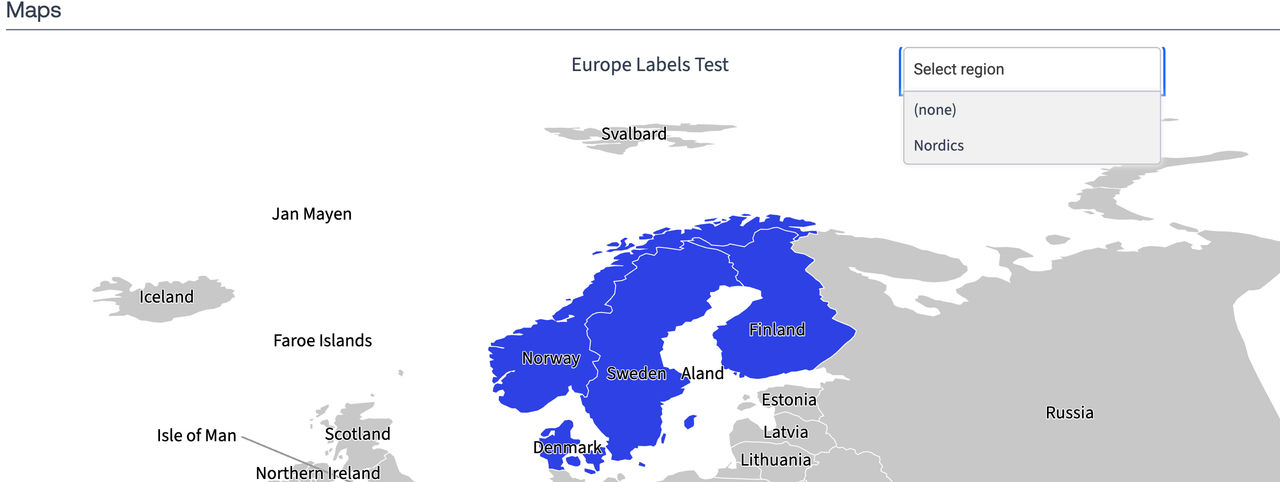
Color Settings
Select a color option to define how colors are displayed across the map.
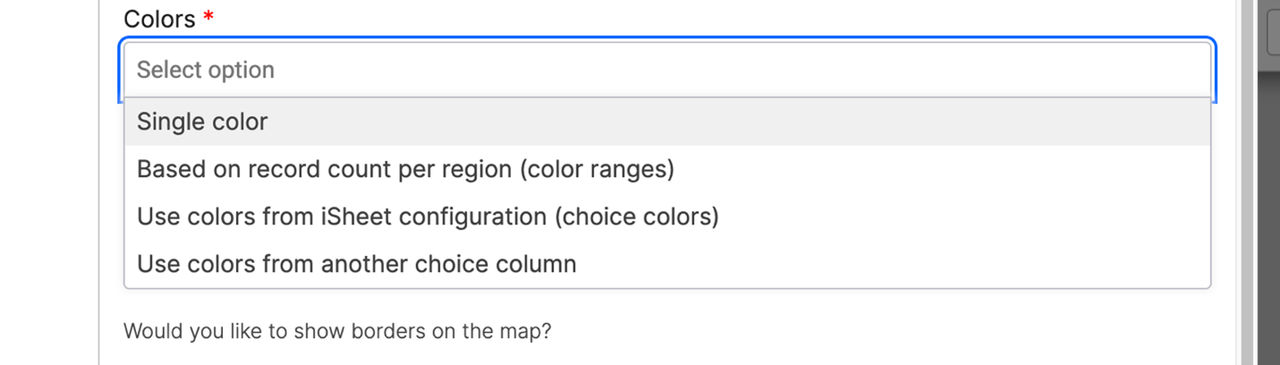
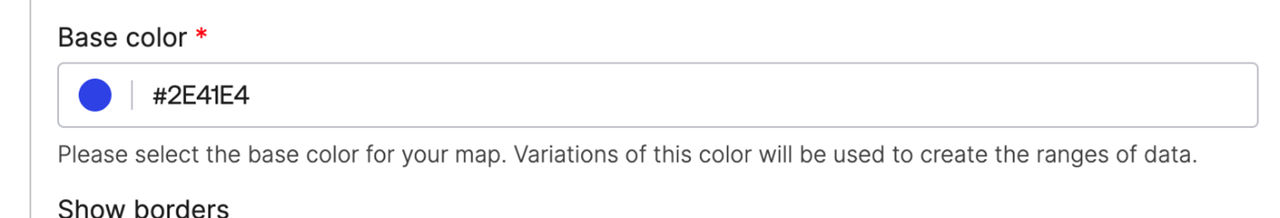
- Single color- All regions with a value are displayed in one colour. Enter a hex colour code (e.g.#2E41E4) in theBase Colorfield, or click the colour picker to browse available colours.
- Based on record per region (color ranges)- This option creates a heat map effect, colouring regions based on the number of iSheet records associated with each area. You can choose from either of the following two methods:
- Automatic- Colour ranges are calculated and applied automatically based on the data. When this option is selected, the Colour ranges are applied based on the data using an equal-interval algorithm derived from the highest record count across regions.
- Custom- Custom colour ranges are based on record counts per region, not raw iSheet values. You can manually define up to 10 colour ranges (buckets) and assign a colour to each, but custom numeric thresholds cannot be set.
Display Options
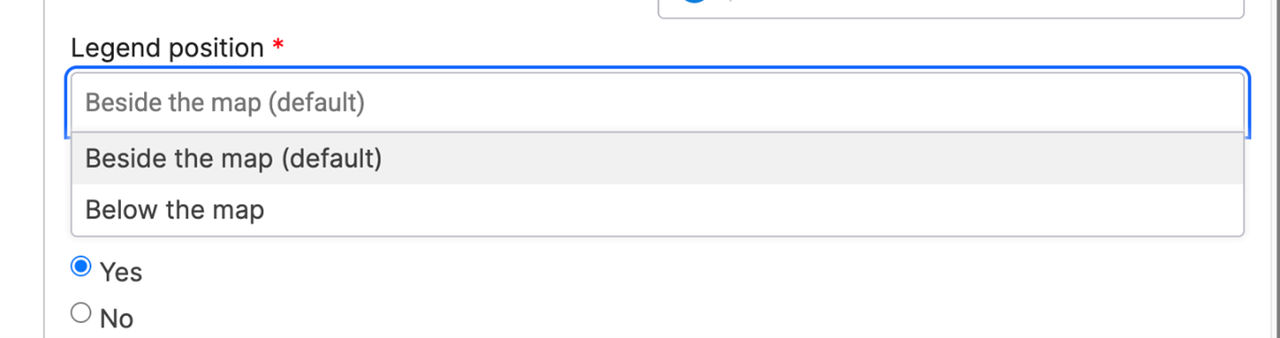
- Legend Position- Choose where the legend appears on the panel (either beside or below the map). The legend displays the colour-coding key, helping users interpret the map at a glance.
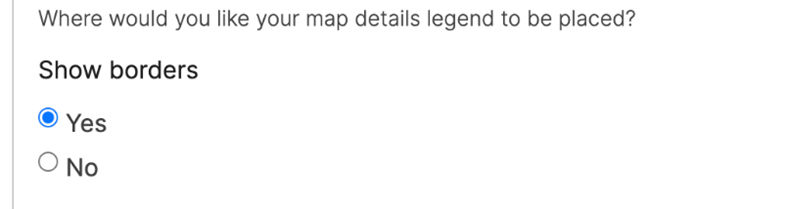
- Show borders- This option allows you to control whether geographic borders are displayed on the map.
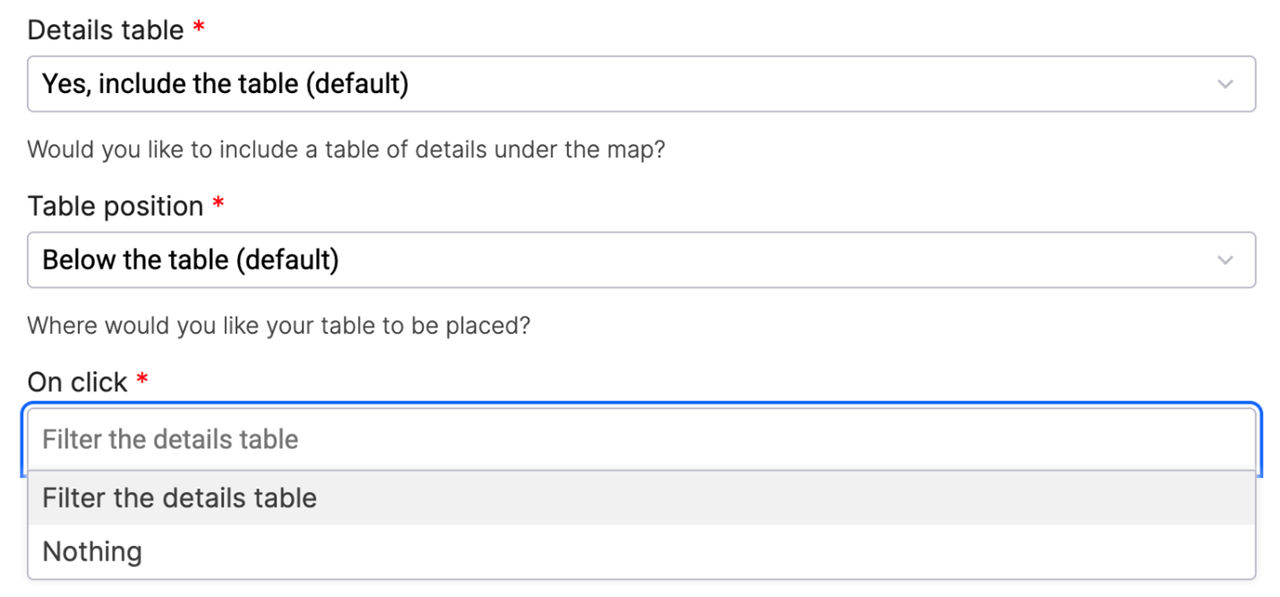
- Details table- This displays the underlying iSheet records in a table view linked to the map. The table can be positioned below the map or to the right of it.
 notePositioning the details table to the right is not recommended for narrow screens.
Interaction Settings
- On click- Controls the action that occurs when a user selects a map region, such as filtering related records in the details table.
- On hover- Configure the information displayed when a user hovers over a map region. The record count is shown by default. The following additional options are available:
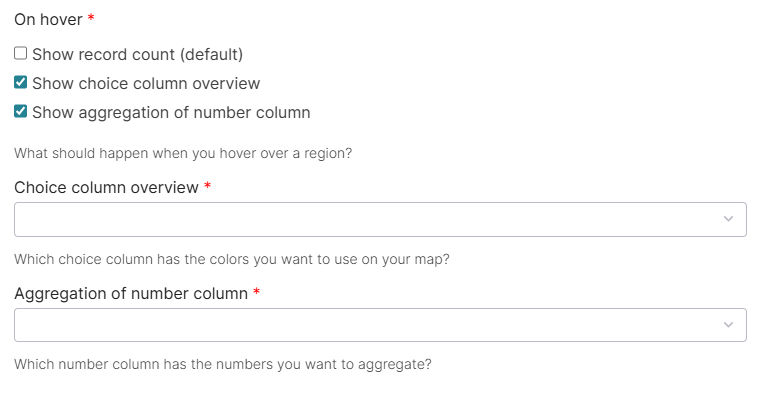
- Show Record Count (default)– Displays the total number of records in the selected region when you hover over it. This option is enabled by default.
- Show Choice Column Overview- Select a choice-type column from the iSheet to display a breakdown of choice values for that region. Only choice-type columns are listed.
- Show Number Column Aggregation- Select a number-type column to display an aggregated (summed) total for all iSheet records within that region. Only number-type columns are listed.
Click
Next
to continue. Review the configuration summary to verify all settings are correct.
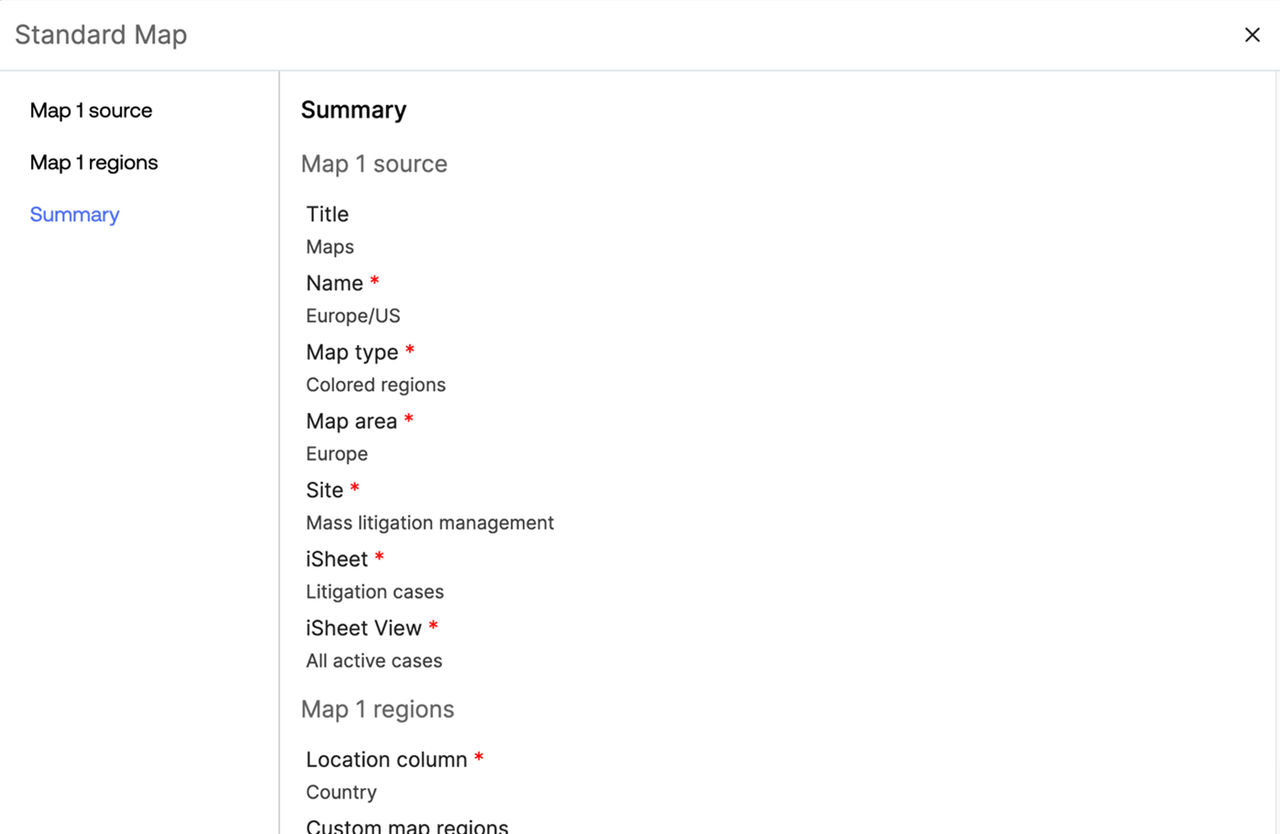
note
With the current HighQ release (5.11), the Map panel cannot be edited once it is added to the dashboard. Ensure all configuration settings are correct before selecting
Create
. Click
Create
to generate the map panel. The map is automatically added to the dashboard panel and is immediately available for use. 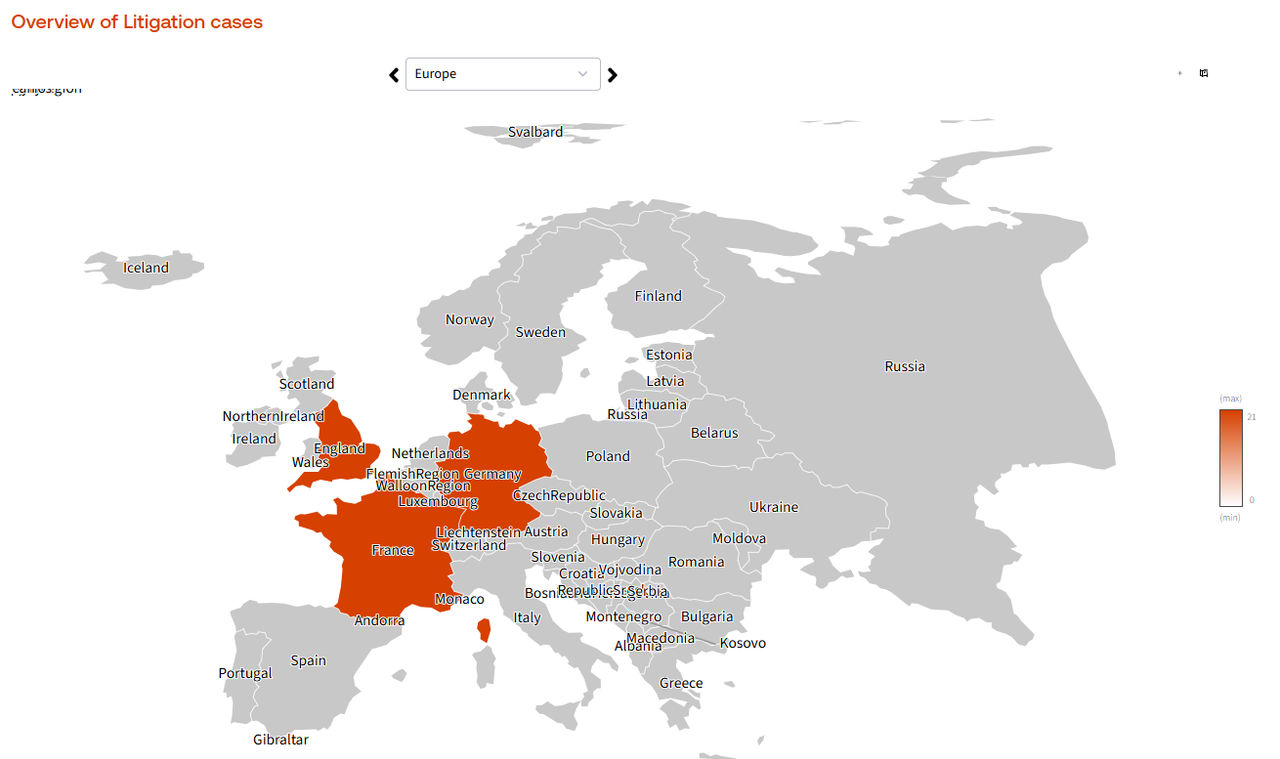
For details on searching and filtering records and the functional components of the Standard Map panel, see Search and Filter Records in Maps.
Related Content
-
Search and filter records in Maps
Format: Article