
Add, edit, and manage nodes in Structured Chart
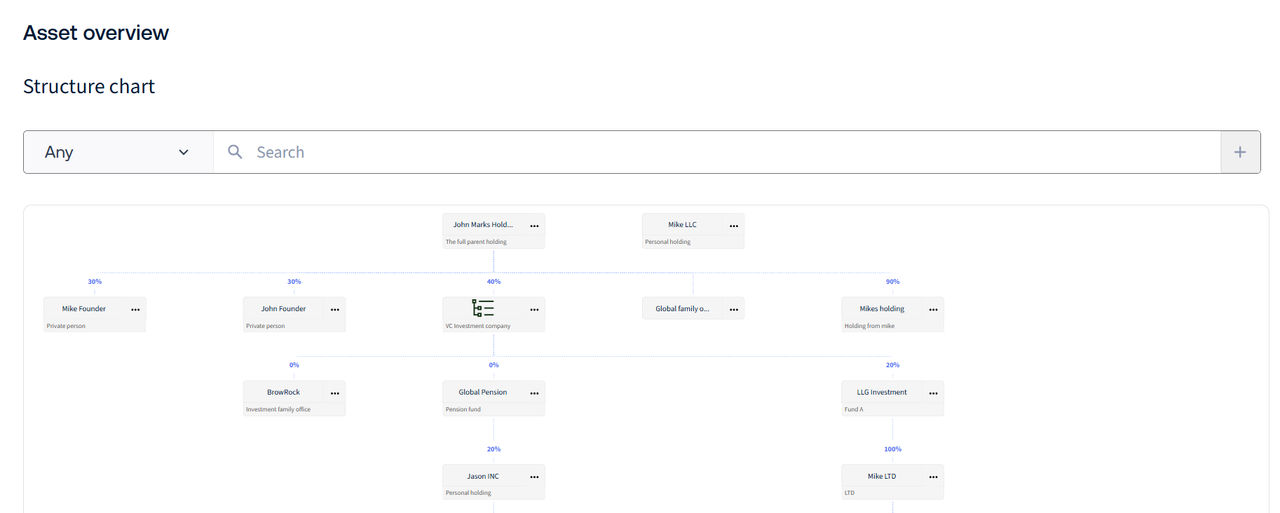
The Structured Chart panel provides an interactive way to view and manage hierarchical task data. From the chart, you can view node details, add or remove nodes, and filter data, all without leaving the dashboard.
Adding a Node
note
Currently, the hierarchy structure supports up to six levels only. An error message is displayed when this limit is reached, and the limit
cannot
be increased.To add a root-level node, edit the main dashboard, then select
Add Box
in the Structured Chart panel header.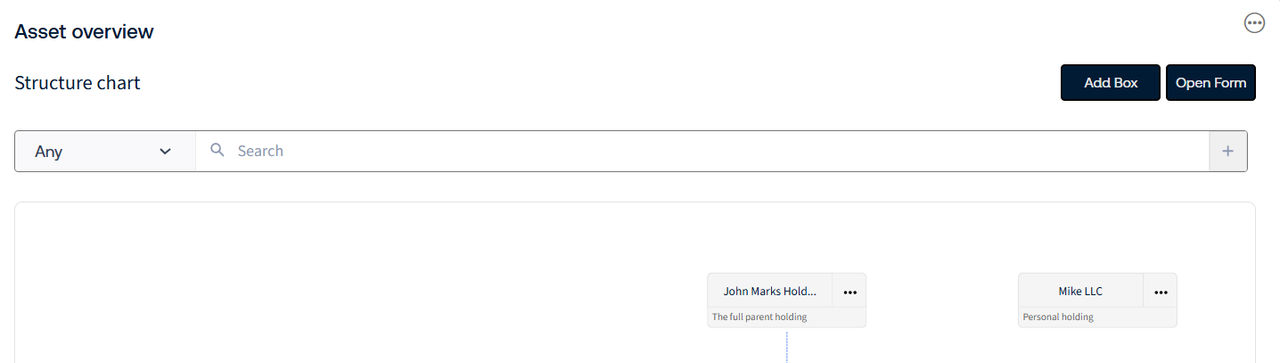
To add a child node, select
Add Child
from the node's options menu. The parent node will be pre-filled automatically. 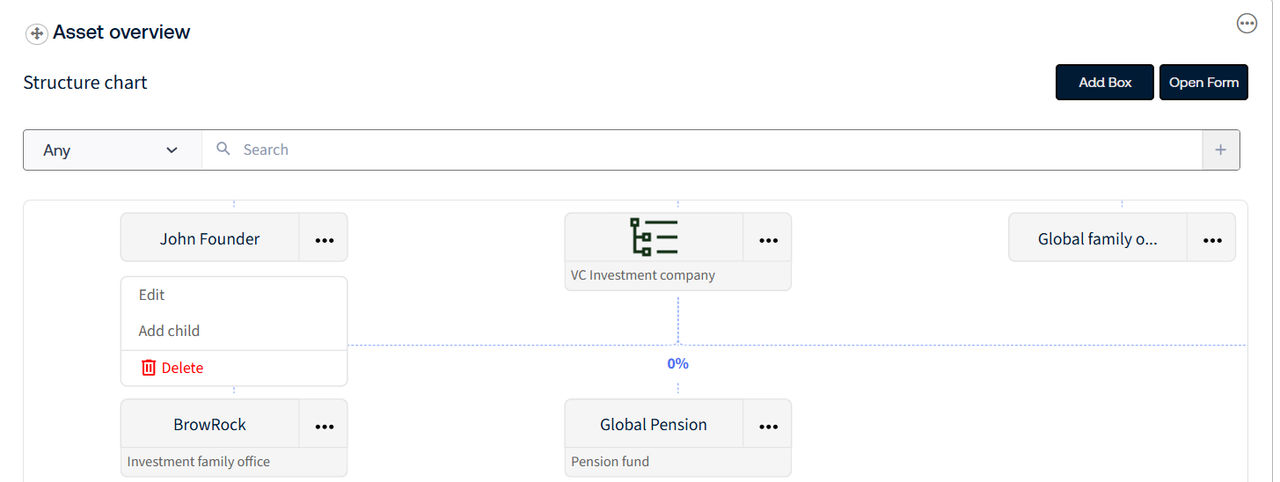
Fill in the required details and click
Save
. Once created, the panel automatically.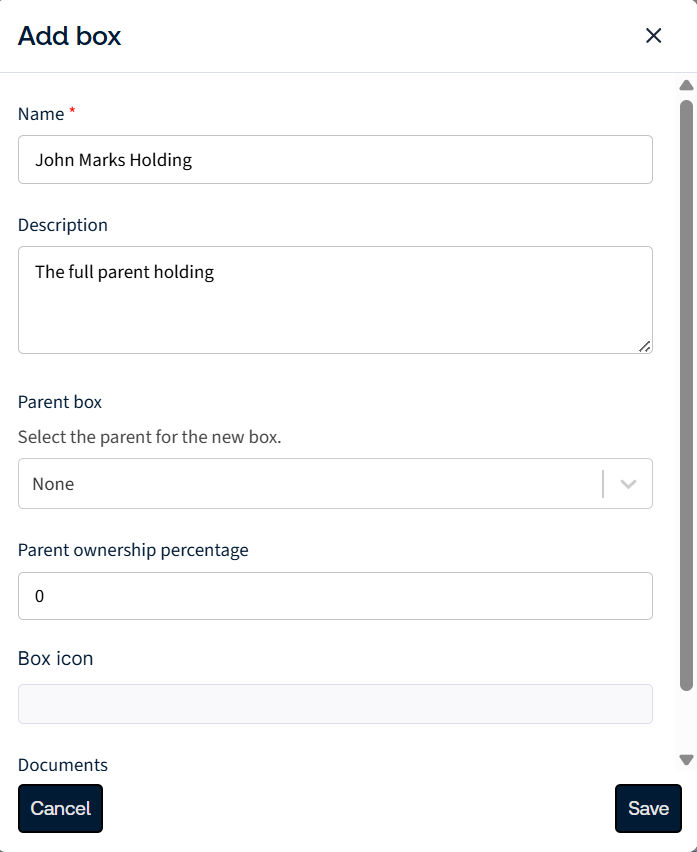
Once created, the panel automatically creates a new HighQ task list, adds a
Task Metadata
task, uploads any provided icons and documents, creates an iSheet row with the metadata, and refreshes the chart.Adding a Child node
To add a child node, select
Add Child
from the node's options menu. The parent node will be pre-filled automatically. note
HighQ task lists support a maximum of 5 nesting levels. If you attempt to add a child beyond this limit, an error message appears 'It is unfortunately not possible to add more than five levels of boxes'.
Viewing and Editing Node details
From the Structured Chart, you can view and edit the details of a task metadata item directly from the nodes.
To view a node's details, click on it to select it. The information panel opens on the left or right side of the chart, depending on your configuration. The panel displays two tabs:
Metadata
and Tasks
. 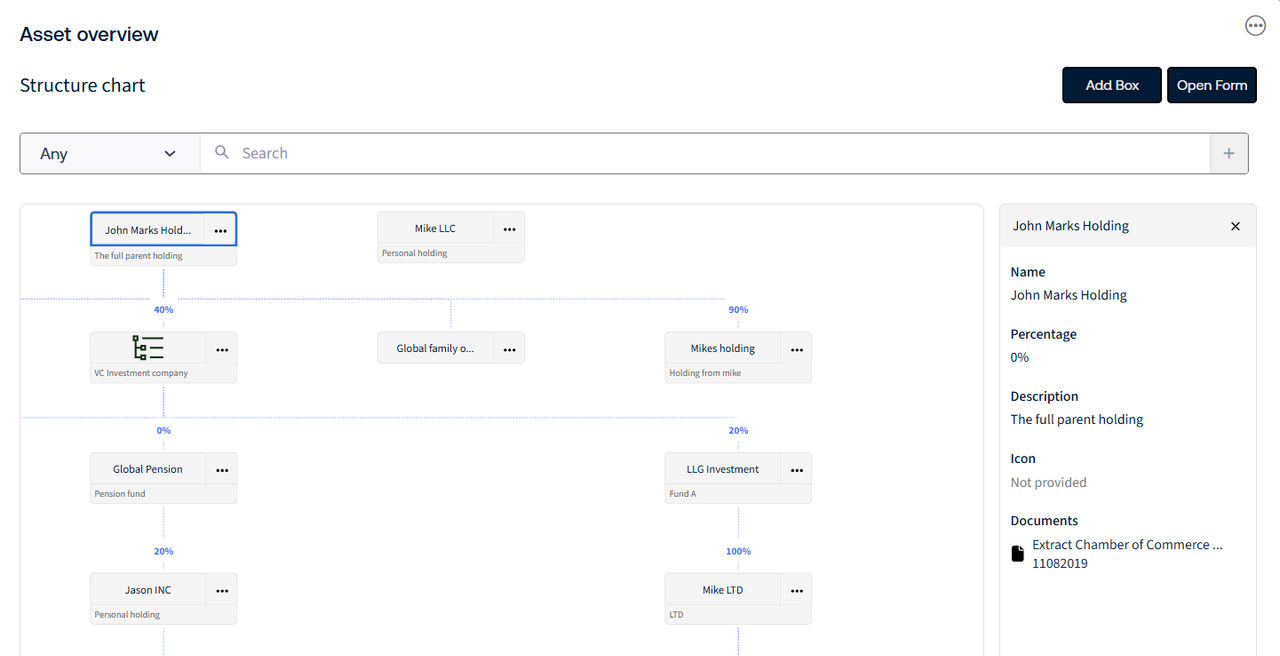
The
Metadata
tab displays the node's metadata fields sourced from the iSheet, including the task list name and any additional custom columns. Each field is rendered according to its column type. For example, text fields display as plain text, numbers are formatted accordingly (with a %
suffix for percentage fields), and choice and score fields appear as colour-coded labels. Dates are shown in a formatted date style, user lookups display as linked usernames, and hyperlinks appear as clickable links. Images are displayed inline, file and folder links appear as clickable names, attachments open in the HighQ document viewer, and auto-increment fields display as plain numbers.
Fields without a value display as
Not provided
. Unsupported column types, such as iSheet link, lookup, join, and calculation, display as Field not supported
.Additonally, the
Tasks
tab lists all tasks belonging to the selected task list. Each task displays its name alongside an Open
button, which navigates to the task in HighQ in a new tab. If the task list has no tasks, the message No tasks found in this list
is displayed. Editing a Node
To edit a node, select
Edit
from the node's options menu. You can update the node's name, description, parent, ownership percentage, icon, and documents. 
Deleting a Node
To delete a node, select
Delete
from the node's options menu. This permanently removes the task list from HighQ and refreshes the chart. 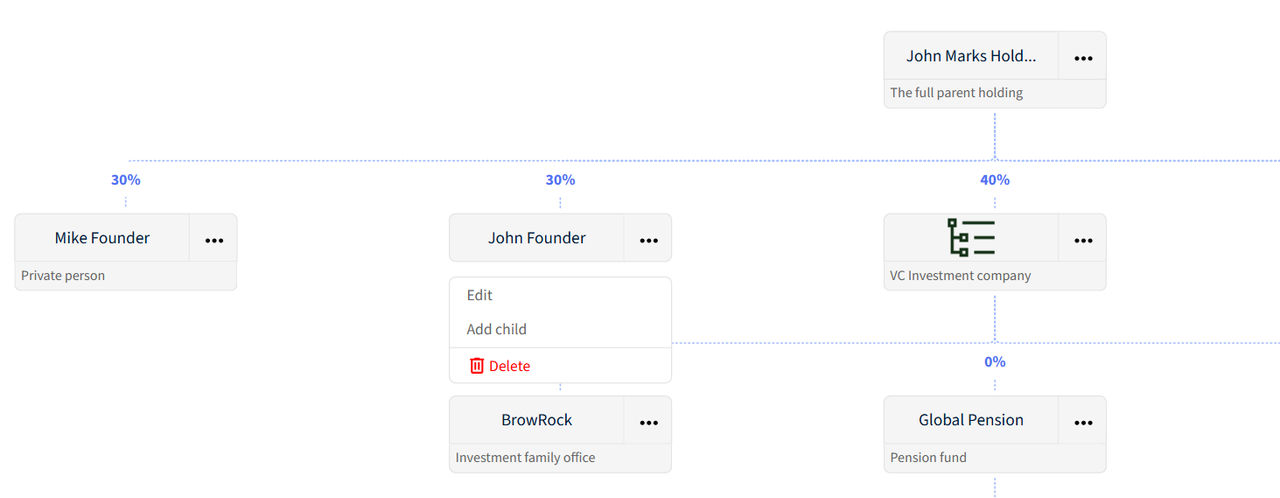
note
Only leaf nodes (nodes with no children) can be deleted.
Filtering Options
Use the filter bar to search and filter chart data. Select
Any
to search across all columns or choose a specific option from the dropdown to refine your search. 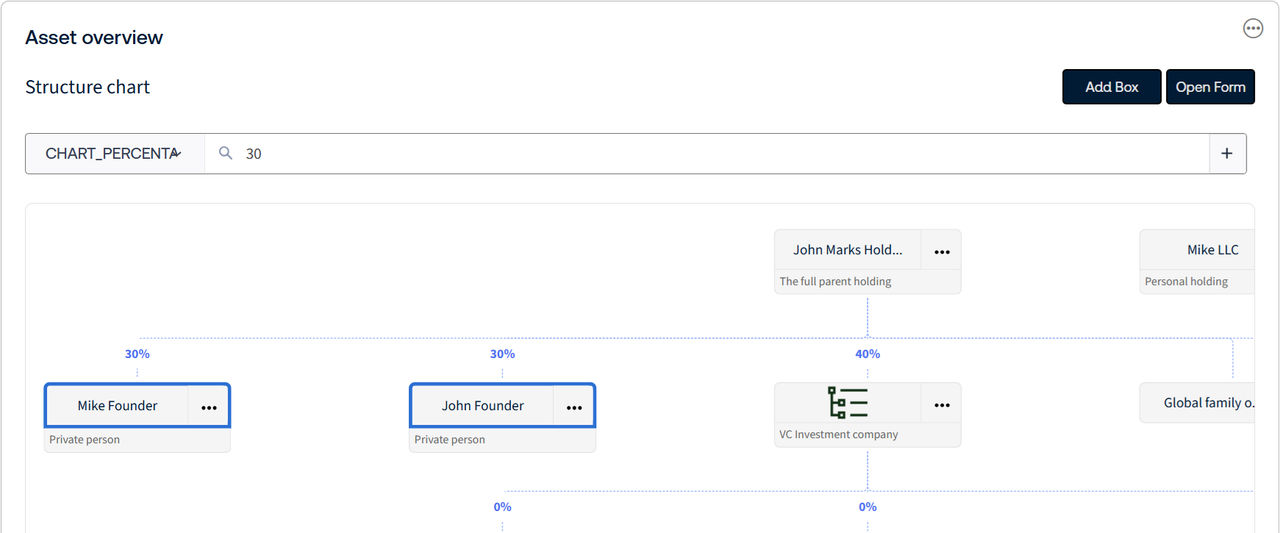
The matching item will be highlighted in the chart and displayed in the information panel.
Open Form
The
Open Form
option displays the existing chart information. If a configuration setting (such as Site
) is changed, the panel reloads with the updated settings and displays data from the newly selected source. Existing data from the previous configuration remains unchanged and is not overwritten. Configuration changes require a new script tag to be generated and manually applied to the dashboard by an administrator before they take effect.
Related Content
-
Structured Chart Panel
Format: Article