
Structured Chart Panel
The Structured Chart panel is an interactive visualization that displays hierarchical, task-based data from Task Metadata iSheets. It helps users easily view and navigate organisational or structural relationships within task data in a clear, visual format.
note
- This panel is available only for System-level and Custom Page dashboards and is available to allHighQ Premiumclients, but is not enabled by default. Please get in touch with your Account or Customer Success representative to enable it.
- The Structured Chart panel requires a Task Metadata iSheet to be available on the selected site. For more information, see Task Metadata iSheets.
Creating a Structured Chart panel
To create a Structured Chart, navigate to your custom page dashboard and select
Edit
dashboard. Click the +
icon, then choose Structured Chart
from the Interactive Data Visualization
panels selection. 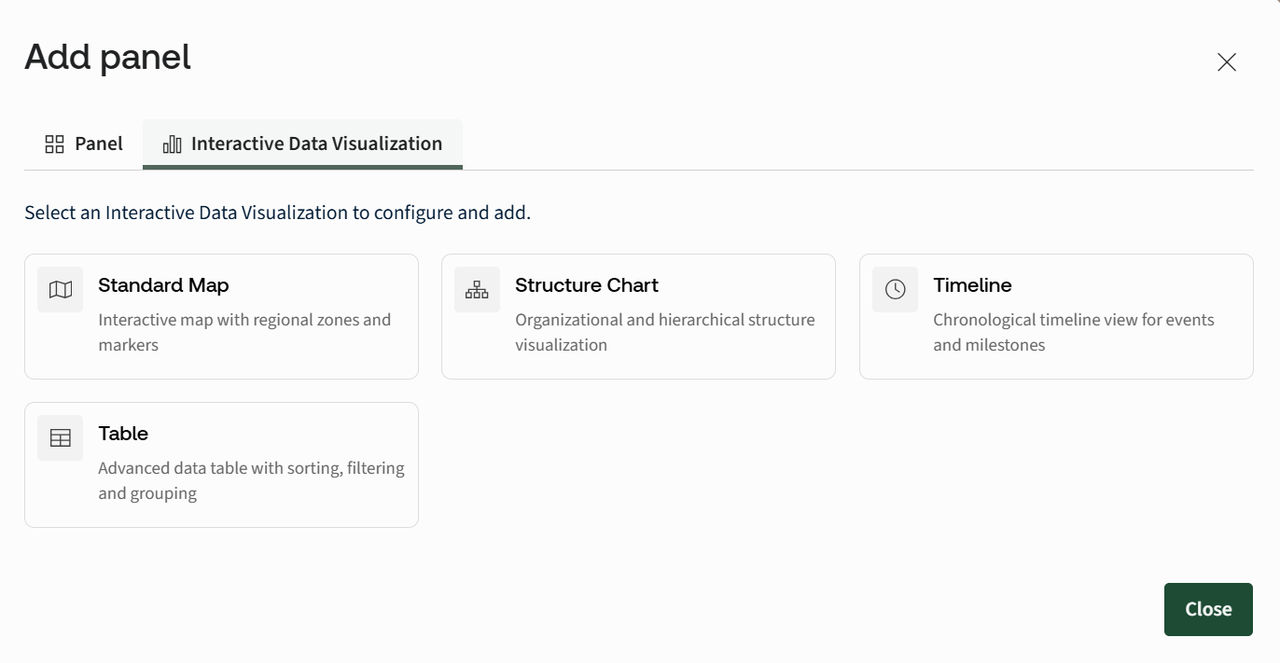
The Structured Chart configuration modal will open.
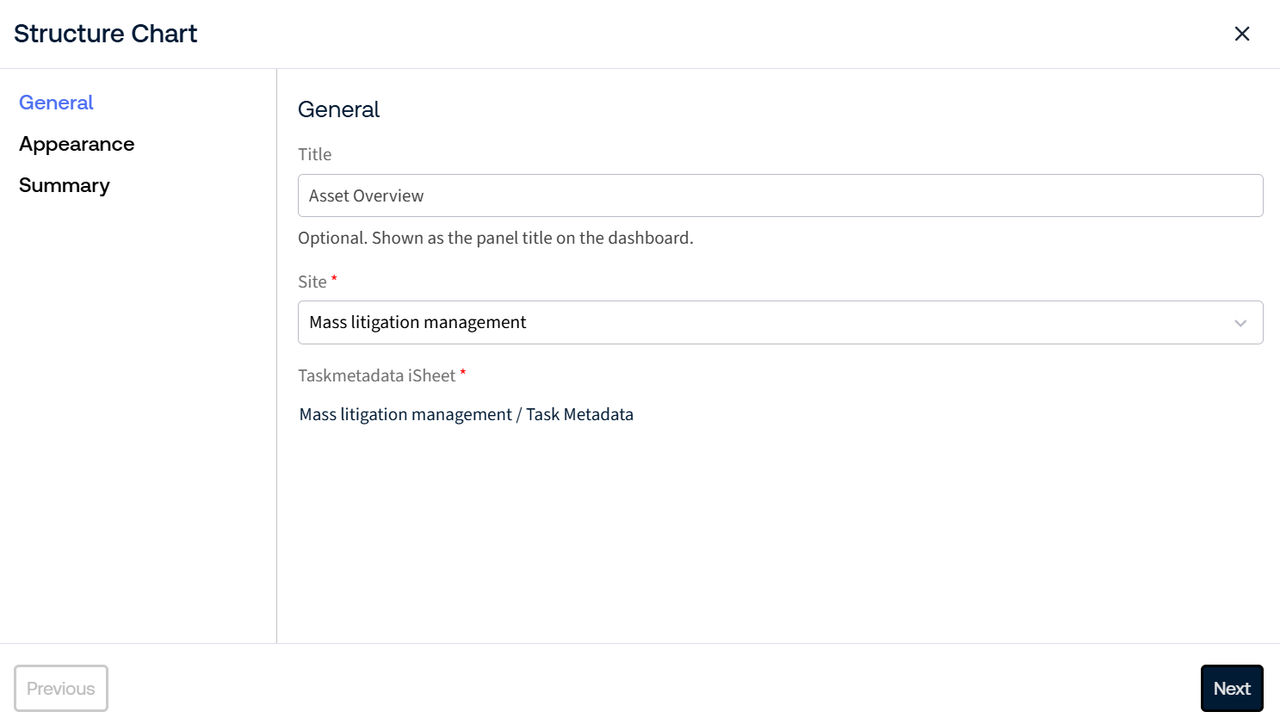
- Title- Enter a title for the chart. The title appears at the top of the chart and is optional.
- Site- Select the site from your HighQ instance that contains the Task Metadata iSheet you want to use. For more information, see Task Metadata iSheets.
note
If the selected site does not have a Task Metadata iSheet, the following message will appear: "
No metadata iSheet found for site: [Site Name]. Metadata iSheet will be automatically generated for this site on form completion.
" When you proceed, a new Task Metadata iSheet is automatically created for the selected site. Click
Next
to continue to the Appearance settings. Appearance Settings
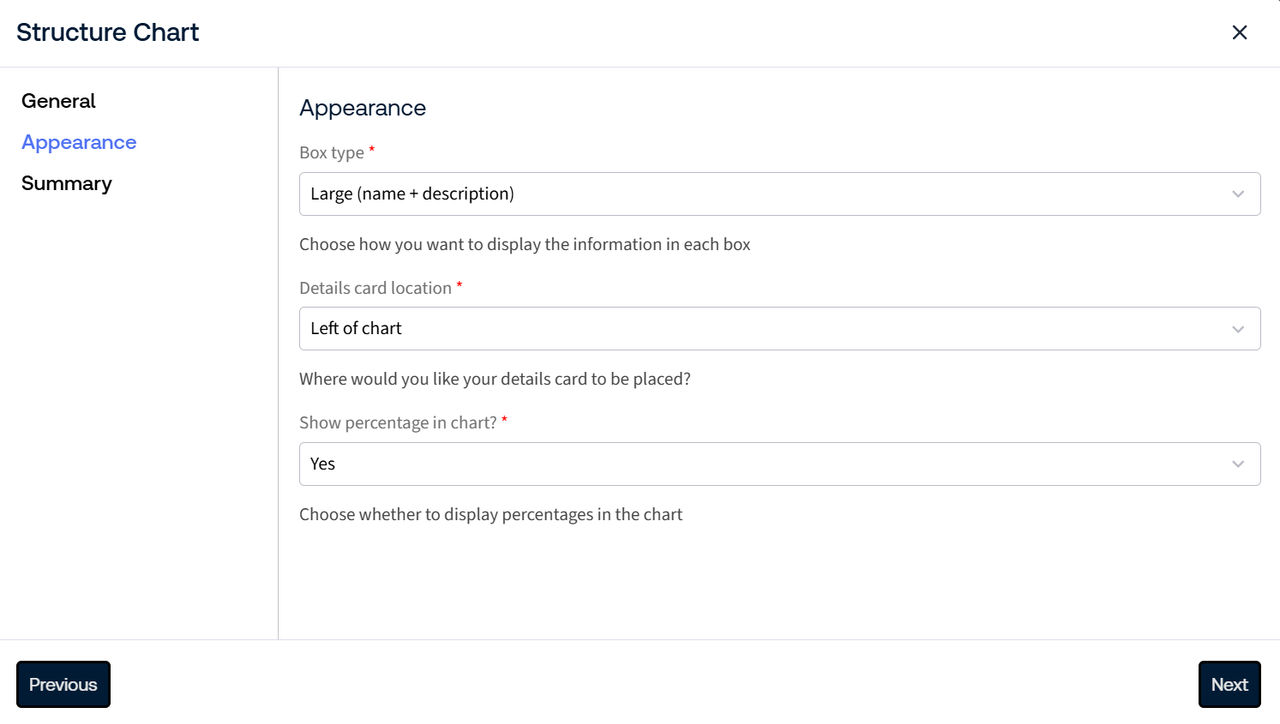
- Box Type- Select how each node in the chart is displayed.
- Small: Displays the title only, with no description.
- Large: Displays both the name and description.
- Details card location- Choose where the details card appears when a user interacts with the chart.
- Left: The details card opens to the left of the chart.
- Right: The details card opens to the right of the chart.
Click
Next
to review the configuration summary. 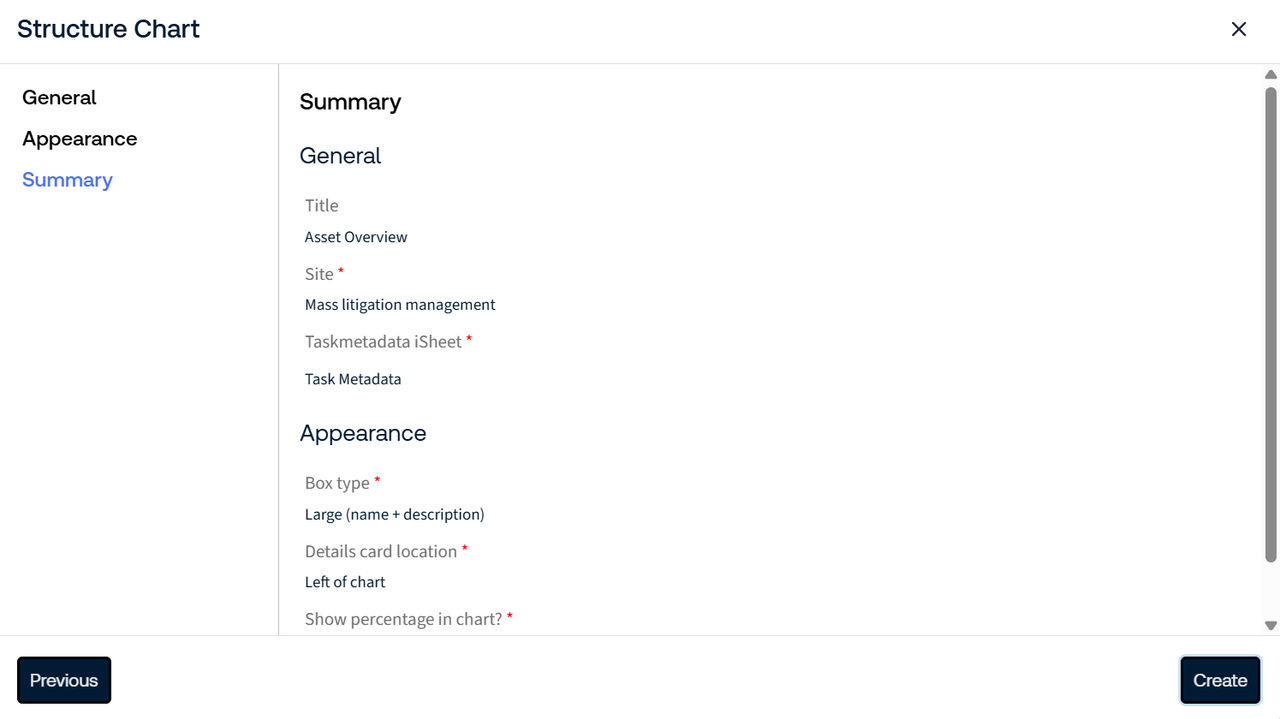
Review all settings carefully to confirm they are correct before proceeding.
note
With the current HighQ release (5.11), the Structured Chart panel cannot be edited once it is added to the dashboard. Ensure all configuration settings are correct before selecting
Create
. Click
Create
to add the Structured Chart panel to the dashboard. The panel is automatically added and is immediately available for use. 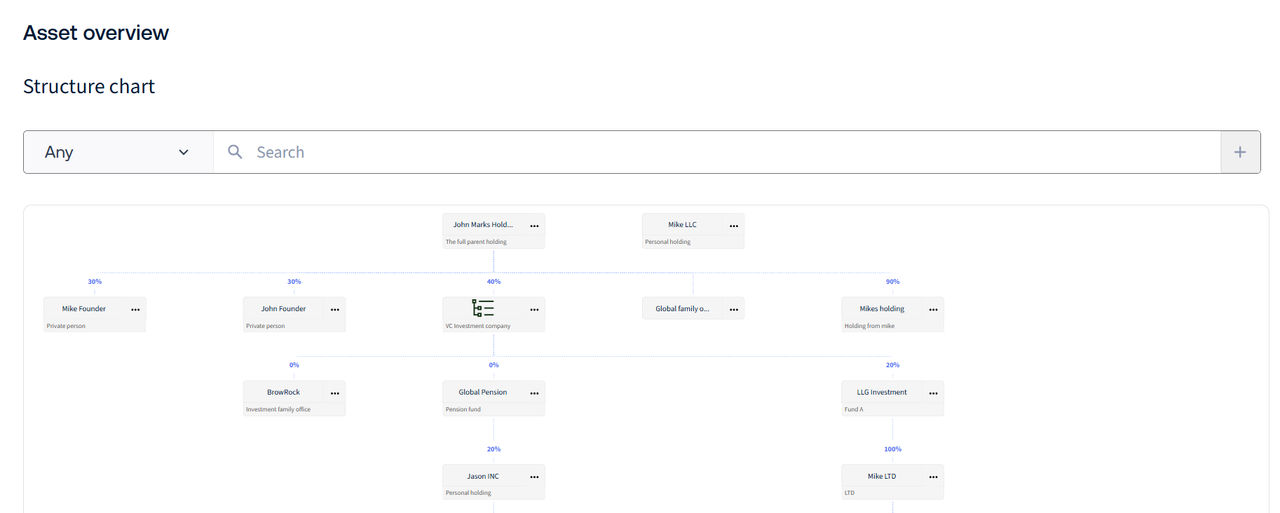
For details on managing Structured Chart nodes, see Add, edit, and manage nodes in the Structured Chart.
Related Content
-
Add, edit, and manage nodes in Structured Chart
Format: Article