
Distribution Reports
Distribution reports allow you to review trends in activity during the chosen period.
Below are the various reports you can generate using the distribution-related templates.
Distribution of Documents Created by User
This report illustrates the trends in Document creation over the chosen time period by the specified users. The report can be built for users, groups or subsites.
To build the report:
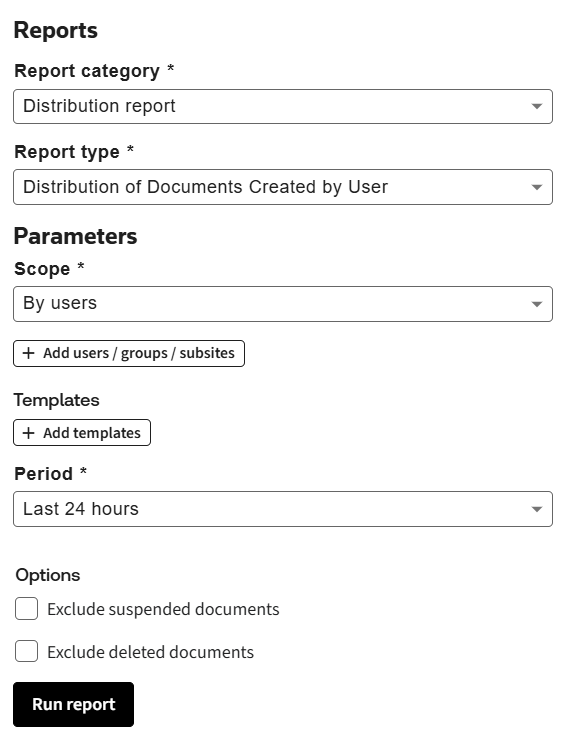
- Set the input parameters for the report:
- Report Category: Distribution report.
- Report Type: Distribution of Documents Created by User.
- Scope: by Users/ Groups/ Subsites. Depending on the chosen value, you will be able to specify either the list of users, of groups, or of subsites, for which the report should be built.
- Users/ Groups/ Subsites: Select the needed users/ groups/ subsites by clicking+ Add users/ groups/ subsites. You can specify up to 20 users/ groups/ subsites.
- Templates: Select the templates you are interested in, or choose all of them by clicking+ Add templates.
- Period: Select the period from the list of pre-set periods available from the dropdown list. If you need to choose a specific period, select ‘Custom period’ value and specify Start Date and End Date.
- Exclude Suspended Documents: Select this checkbox if you want to exclude Documents marked as ‘Suspended’ from the report. (see Suspending documents for more information about suspending a Document).
- Exclude Deleted Documents: Select this checkbox if you want to exclude deleted Documents from the report.
- ClickRun Report.
The report will contain a graph and a table with the data.
The graph demonstrates, how many documents have been created by
all
selected users during the increments within the chosen period, broken down by template. You can toggle the graph view using Grouped/ Stacked control.The table contains filterable representation of the same data. Click on the filter icon to enable filtering. You can collapse or expand the sections of the table by clicking on a period or to collapse/ expand the whole table use the
Expand
/ Collapse
buttons.Distribution of Documents by Template
This report illustrates the trend in document creation over the chosen period by the specified templates.
To build the report:
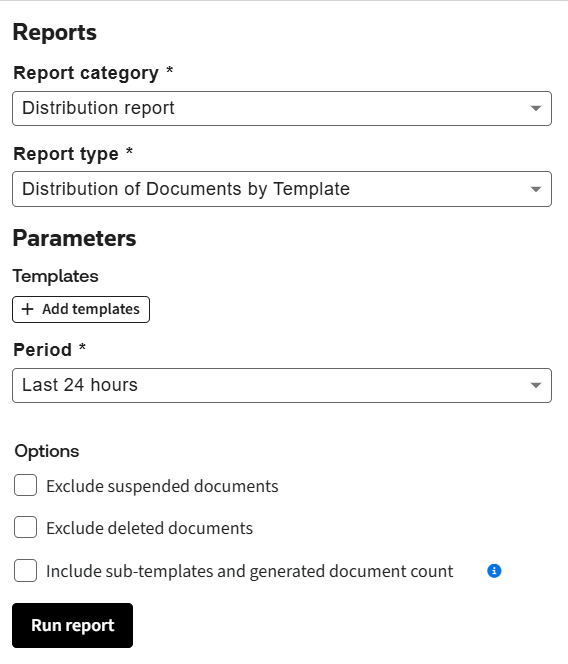
- Set input parameters for the report:
- Report Category: Distribution report.
- Report Type: Distribution of Documents Created by Template.
- Templates: Select the templates you are interested in or choose all of them by clickingAdd templates.
- Period: Select the period from the list of pre-set periods available from the dropdown list. If you need to choose a specific period, select ‘Custom period’ value and specify Start Date and End Date.
- Exclude Suspended Documents: Select this checkbox if you want to exclude the documents marked as ‘Suspended’ from the report. (see Suspending documents for more information about suspending a Document).
- Exclude Deleted Documents: Select this checkbox if you want to exclude deleted documents from the report.
- Include sub-templates and generated document count: Select this checkbox if you want to list all sub templates which have generated separate documents, as well as the details of the template that was used to start questionnaire (main template).
- ClickRun Report
The report will contain a graph and a table with the data.
The graph demonstrates how many documents have been created from the selected templates during each increment within the chosen period, broken down by template. You can toggle the graph view using Grouped/ Stacked control.
The table contains filterable representation of the same data. You can collapse or expand the sections of the table by clicking a template’s name. To collapse/ expand the whole table use
Expand
/ Collapse
buttons.Distribution of Documents by Status
This report illustrates the trend in changing the statuses of the documents created during the given time increment.
To build the report:
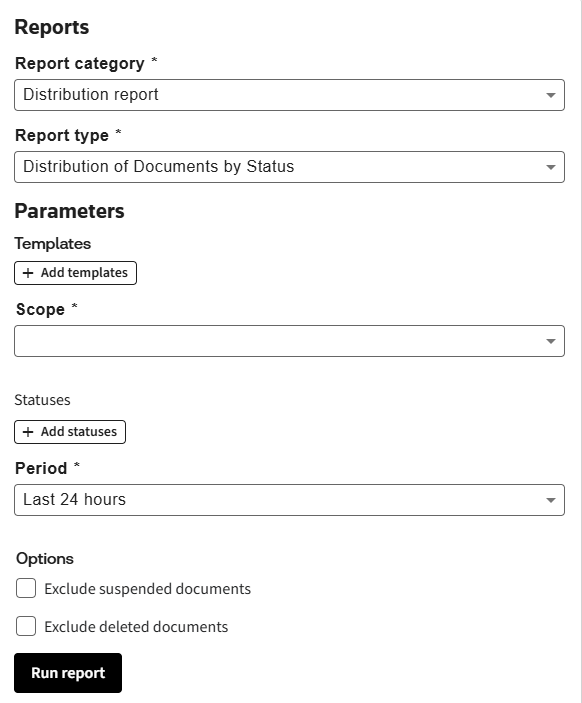
- Set input parameters for the report:
- Report Category: Distribution report.
- Report Type: Distribution of Documents by Status.
- Templates: Select the templates you are interested in, or choose all of them by clicking+ Add templates.
- Scope: Choose ‘By single statuses’ to see the report broken down by all document statuses.If you want an aggregated view, select ‘By grouped statuses’. In this case, only 3 aggregated statuses will be used: New (incorporates the following statuses: Incomplete, Requires Approval, Awaiting Approval, Rejected, In Negotiation), Drafted (incorporates Ready, Sent for Signature statuses), Executed (only Executed).
- Statuses: Select the document statuses you are interested in. Depending on the value of the Scope parameter, you can choose either from the complete list of statuses or from the list of aggregated statuses.
- Period: Select the period from the list of pre-set periods available from the dropdown list. If you need to choose a specific period, select ‘Custom period’ value and specify Start Date and End Date.
- Exclude Suspended Documents: Select this checkbox if you want to exclude the documents marked as ‘Suspended’ from the report. (see Suspending documents for more information about suspending a Document).
- Exclude Deleted Documents: Select this checkbox if you want to exclude deleted documents from the report.
- ClickRun Report
The report will contain a graph and a table with the data.
The graph demonstrates, how many documents have been in particular statuses during the given time increment, broken down by status. You can toggle the graph view using Grouped/ Stacked control.
The table contains filterable representation of the same data. You can collapse or expand the sections of the table by clicking on a status name. To collapse/ expand the whole table use
Expand
/ Collapse
buttons.Average Approval Cycle Time by Template
This report illustrates the average duration of the approvals for documents, created from the selected template, broken down by time increments.
To build the report:
- Set input parameters for the report:
- Report Category: Distribution report.
- Report Type: Average Approval Cycle Time.
- Template: Select the template you are interested in from the dropdown list.This report can be built for a single template only, as the set of approval steps may differ for different templates.
- Approval steps: Select the approval steps you are interested in, or select all of them by clicking+ Add approval steps.
- Period: Select the period from the list of pre-set periods available from the dropdown list. If you need to choose a specific period, select ‘Custom period’ value and specify Start Date and End Date.
- Exclude Suspended Documents: Select this checkbox if you want to exclude the documents marked as ‘Suspended’ from the report. (see Suspending documents for more information about suspending a Document).
- Exclude Deleted Documents: Select this checkbox if you want to exclude deleted documents from the report.
- ClickRun Report.

The report will contain a graph and a table with the data.
The graph demonstrates the longest, shortest and average duration of the approval per approval step basis for a specific time increment. Hover over the average value to see the name of the approval step.
The report table contains average durations of the approval steps (rounded up, in days) for the time increments, broken down by approval steps. You can collapse or expand the sections of the table by clicking on a time period.
Average Negotiation Cycle Time by Template
This report illustrates the average duration of the negotiation tasks for documents, created from the selected templates, broken down by time increments.
To build the report:
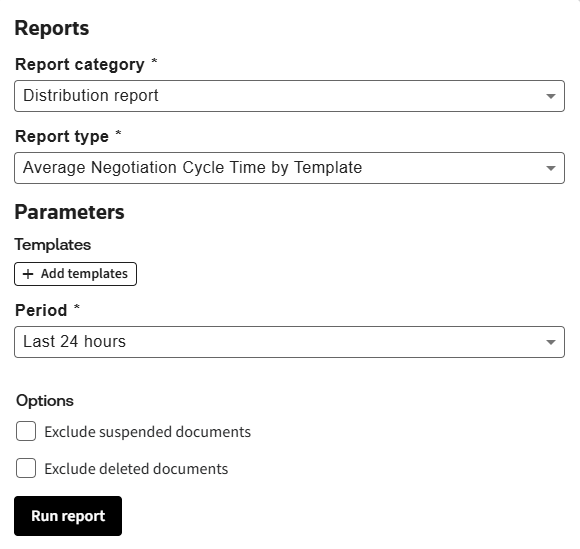
- Set input parameters for the report:
- Report Category: Distribution report.
- Report Type: Average Negotiation Cycle Time.
- Templates: Select the templates you are interested in, or choose all of them by clicking+ Add templates.
- Period: Select the period from the list of pre-set periods available from the dropdown list. If you need to choose a specific period, select ‘Custom period’ value and specify Start Date and End Date.
- Exclude Suspended Documents: Select this checkbox if you want to exclude the documents marked as ‘Suspended’ from the report. (see Suspending documents for more information about suspending a Document).
- Exclude Deleted Documents: Select this checkbox if you want to exclude deleted documents from the report.
- ClickRun Report.
The report will contain a graph and a table with the data.
The graph demonstrates the longest, shortest and average duration of the negotiation per template basis for a specific time increment. Hover over the average value to see the name of the template.
The report table contains average durations of the negotiation (rounded up, in days) for the time increments, broken down by template name. You can collapse or expand the sections of the table by clicking on a time period.
Average Signature Cycle Time by Template
This report illustrates how long it takes to get the signature for documents, created from the selected templates, broken down by time increments.
To build the report:
- Set input parameters for the report:
- Report Category: Distribution report.
- Report Type: Average Signature Cycle Time.
- Templates: Select the templates you are interested in, or choose all of them by clicking+ Add templates.
- Signature: Select the type of the signature you are interested in.
- If ‘eSignature Signature’ is chosen, the average signature cycle time will be calculated only for the documents, e-signed with your chosen eSignature provider, DocuSign or Adobe Sign.
- If ‘Both Manual and eSignature’ the average signature cycle time will be calculated for all documents regardless the signature type.
- Period: Select the period from the list of pre-set periods available from the dropdown list. If you need to choose a specific period, select ‘Custom period’ value and specify Start Date and End Date.
- Exclude Suspended Documents: Select this checkbox if you want to exclude the documents marked as ‘Suspended’ from the report. (see Suspending documents for more information about suspending a Document).
- Exclude Deleted Documents: Select this checkbox if you want to exclude deleted documents from the report.
- ClickRun Report.

The report will contain a graph and a table with the data.
The graph demonstrates the longest, shortest and average duration of the signature cycle per template basis for a specific time increment. Hover over the average value to see the name of the template.
The report table contains average durations of the signature cycle (rounded up, in days) for the time increments, broken down by templates. You can collapse or expand the sections of the table by clicking an increment’s name.
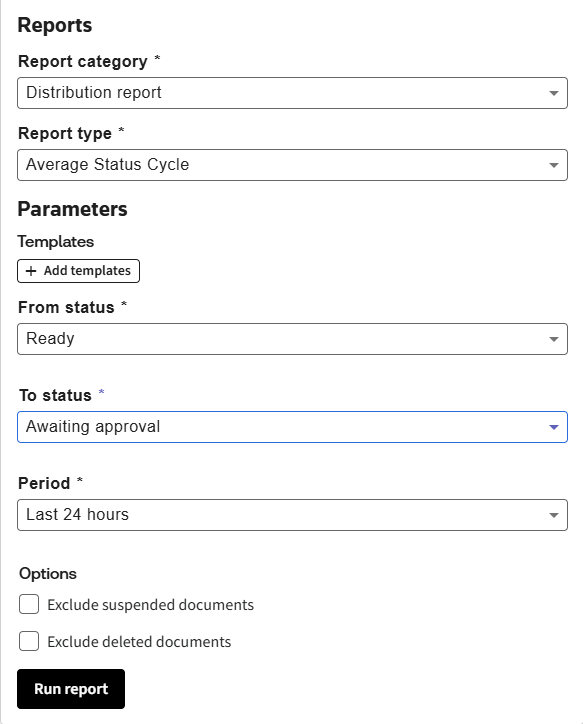
Average Status Cycle
This report illustrates the average duration of the transition between two chosen contract statuses for the selected templates.
To build the report:
- Set input parameters for the report:
- Report Category: Distribution report.
- Report Type: Average Status Cycle.
- Templates: Select the templates you are interested in, or choose all of them by clicking+ Add templates.
- From Status: Choose the first contract status of the transition you are interested in.
- To Status: Choose the second contract status of the transition you are interested in.Example on the right will calculate the average duration of the transition between the ‘Requires Approval’ and the ‘Ready’ status.
- Period: Select the period from the list of pre-set periods available from the dropdown list. If you need to choose a specific period, select ‘Custom period’ value and specify Start Date and End Date.
- Exclude Suspended Documents: Select this checkbox if you want to exclude the documents marked as ‘Suspended’ from the report. (see Suspending documents for more information about suspending a Document).
- Exclude Deleted Documents: Select this checkbox if you want to exclude deleted documents from the report.
- ClickRun Report.
The report will contain a graph and a table with the data.
The graph demonstrates the longest, shortest and average duration of the transition between two chosen statuses per template basis for a specific time increment. Hover over the average value to see the name of the template.
The report table contains average durations of the transition between two chosen statuses (rounded up, in days) for the time increments, broken down by templates. You can collapse or expand the sections of the table by clicking on a time period.
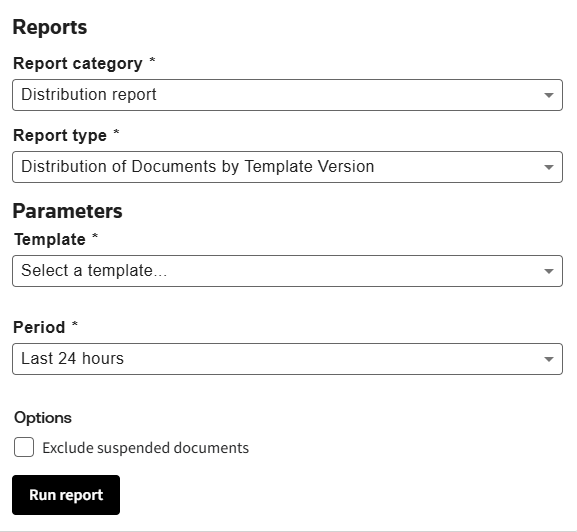
Distribution of Documents by Template Version
This report illustrates the usage of the different versions of the chosen template.
To build the report:
- Set input parameters for the report:
- Report Category: Distribution report.
- Report Type: Distribution of Documents by Template Version.
- Template: Select the template you are interested in from the dropdown list.This report can be built for a single template only.
- Period: Select the period from the list of pre-set periods available from the dropdown list. If you need to choose a specific period, select ‘Custom period’ value and specify Start Date and End Date.
- Exclude Suspended Documents: Select this checkbox if you want to exclude the documents marked as ‘Suspended’ from the report. (see Suspending documents for more information about suspending a Document).
- ClickRun Report.
The report will contain a graph and a table with the data.
The graph demonstrates how many documents have been created from the particular version of the chosen template during the time increment, broken down by the template version. You can toggle the graph view using Grouped/ Stacked control.
The report table contains the same data. You can collapse or expand the sections of the table by clicking on a time period.
By clicking the value in the “Number of Documents” column you can view the corresponding list of Documents created from a particular template version during the defined time period.
Number of logins within period
This report illustrates the statistics on total number of logins to Contract Express within the specified period.
To build the report:
- Set input parameters for the report:
- Report Category: Distribution report.
- Report Type: Number of logins within period.
- Period: Select the period from the list of pre-set periods available from the dropdown list. If you need to choose a specific period, select ‘Custom period’ value and specify Start Date and End Date.
- ClickRun Report.
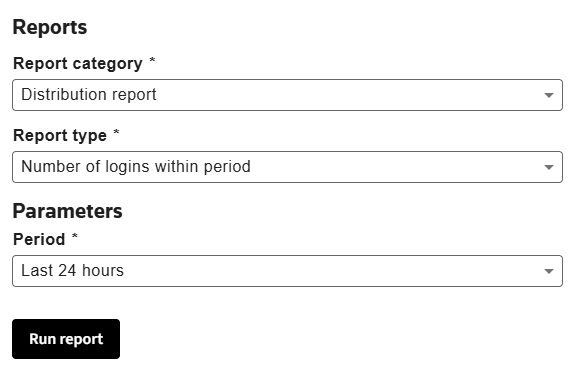
The report will display a chart specifying the number of logins during the selected period.