
FTA Summary
The first page of the reports has the following two reports. The page allows you to toggle between the table and the chart.
FTAs by Savings
This report provides a list of the FTAs that would provide the company with the greatest savings. Compare duty savings by FTA, product, and country. Savings are calculated based on the assumption your goods qualify as originating under the FTA rules of origin.
Chart view
This is the default view when you access the report screen. This view gives you a glimpse of the recommended FTAs by savings.

Table view
To view the details, you can click on the toggle to view the table. Once you click, the table is shown with the details of the savings by FTAs.
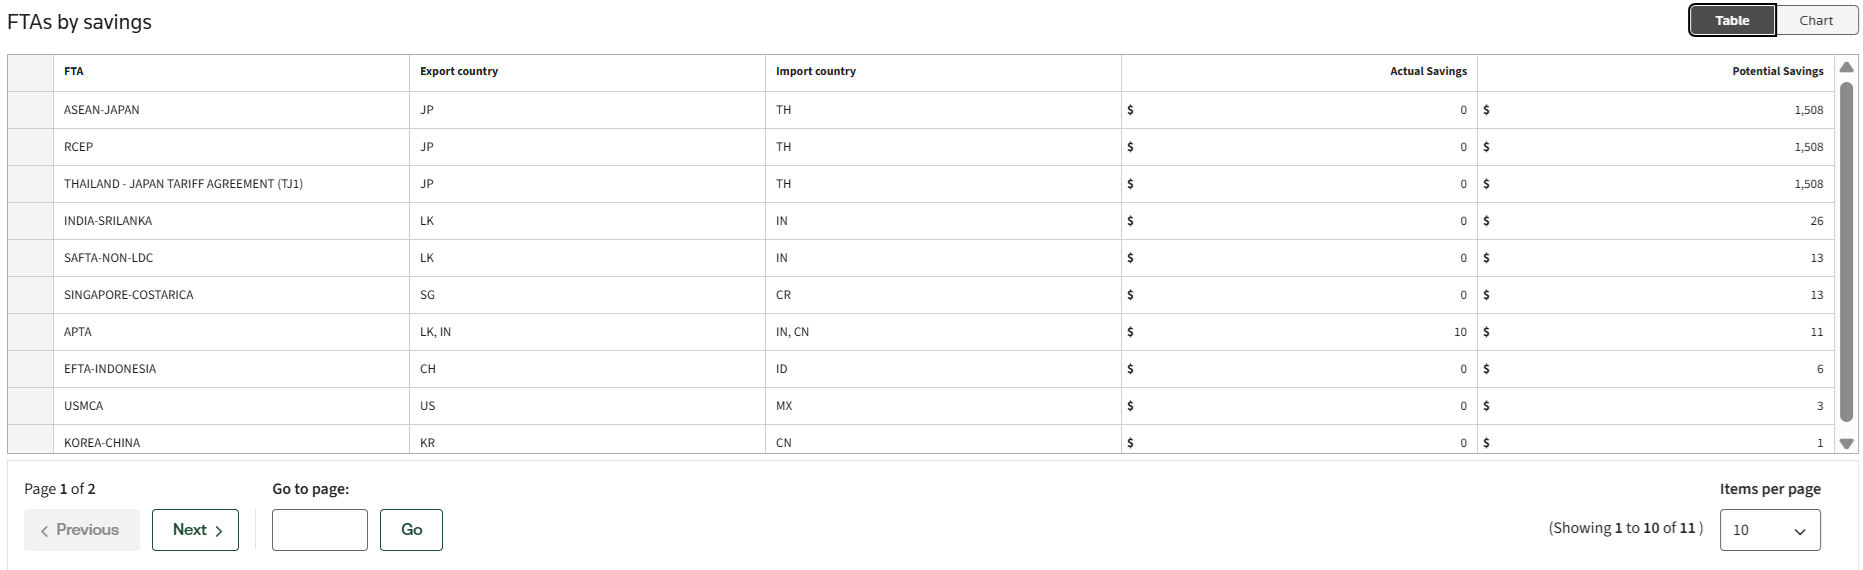
If there are multiple pages, you can click the arrow to view the next page or enter the page number you would like to view and click Go.
Potential future savings
important
Important: This is only available if you are integrated with FTA Management.
This report provides the user with the ability to see if they are claiming the maximum potential savings from an FTA.
important
You can select different agreements by clicking the “FTA” dropdown.

All possible FTAs across trade lanes
This report provides a list of the FTAs across the trade lanes for the data file that was uploaded.
Chart view
This is the default view when you access the report screen. This view gives you a glimpse of the most common FTAs across the trade lanes.

Table view
To view the details, you can click on the toggle to view the table.

Once you click, the table is shown with the details of the most common FTAs across the trade lanes.
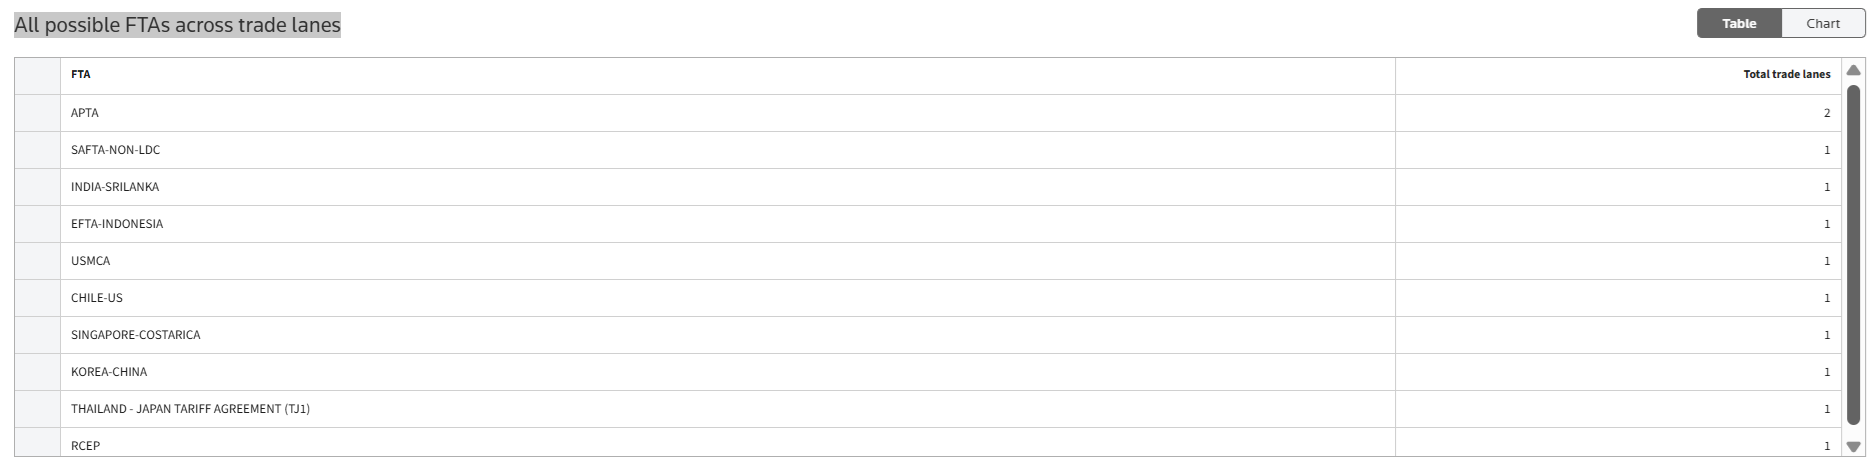
If there are multiple pages, you can click the arrow to view the next page or enter the page number you would like to view and click Go.
Savings by Product
This report provides a list of savings for each of the products in the uploaded spreadsheet. Compare duty savings by FTA, product, and country. Savings are calculated based on the assumption your goods qualify as originating under the FTA rules of origin.
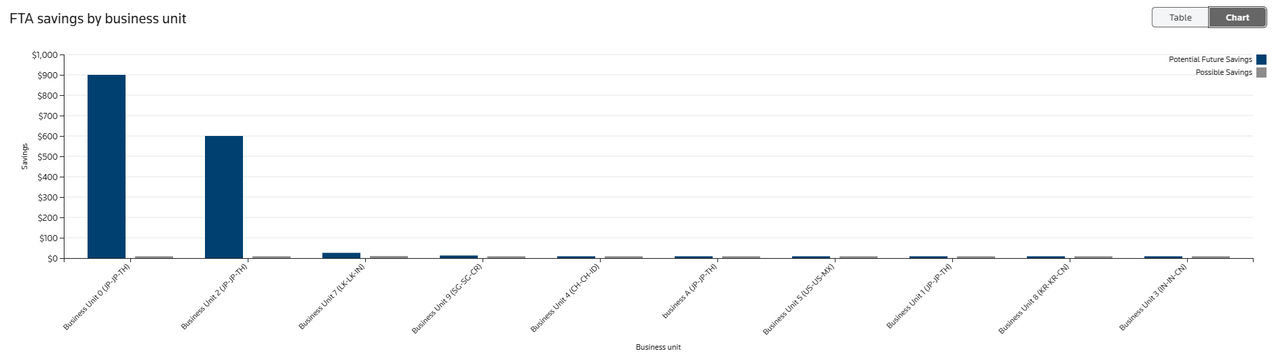
FTA Savings by Business Unit
This report provides a list of savings for each of the products by the Business Unit in the uploaded spreadsheet.
Table view
This is the default view when you access the report screen. Columns correspond to the data in the upload file. The savings are calculated.
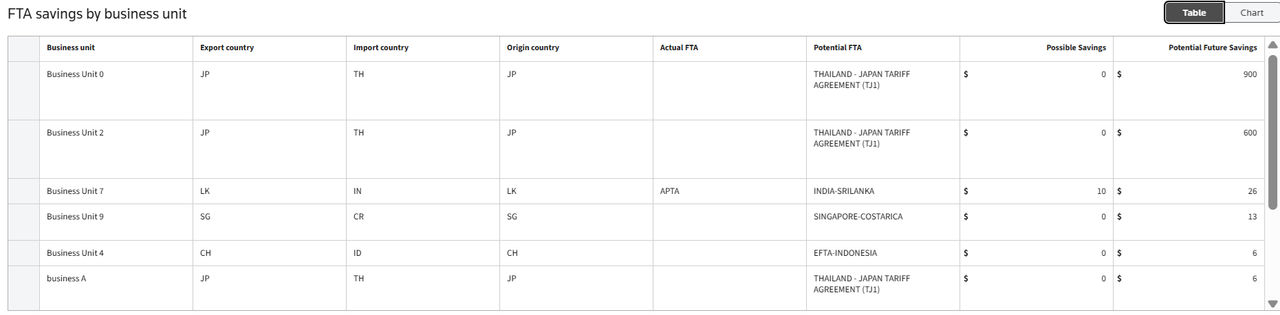
If there are multiple pages, you can click the arrow to view the next page or enter the page number you would like to view and click Go.
Chart view
To view the chart, you can click on the toggle to view the graph.

This view gives you a graphical representation of the data in the table.
FTA Savings by Product Group (optional)
This report provides a list of savings for each of the products by the Product Group column in the uploaded spreadsheet. This report will only appear if
Product group
is populated on the uploaded spreadsheet.Table view
This is the view when you are integrated with FTA Management.

This is the view when you are not integrated with FTA Management.

Chart view
This is the view when you are integrated with FTA Management.

This is the view when you are not integrated with FTA Management.

Related Content
-
Free Trade Agreement (FTA) Analyzer
Format: Article