Electric vehicle scenarios and main assumptions
The electric vehicle scenarios are based on estimates for future car sales, fleet, fuel/electricity consumption and tailpipe emissions. The starting point was historic data (2005-2015) from OICA, IEA, EPA, ACEA and various national sources.
Historic numbers and future estimates are for passenger cars only as defined by OICA here, but include our estimates for light commercial vehicles.
Passenger cars are road motor vehicles, other than a motorcycle, intended for the carriage of passengers and designed to seat no more than nine persons (including the driver). The term “passenger cars” therefore covers taxis and hired passenger cars, provided that they have fewer than ten seats. This category may also include pick-ups or microcars (need no permit to be driven).
Vehicle technologies
Historic sales and fleet numbers were split into five different vehicle categories based on technology: gasoline, diesel, hybrids, BEV (battery electric vehicles) and other (flex fuel cars, natural gas, LPG, hydrogen). The split were based on national statistics when available, otherwise on assumptions by the model developer.
Hybrids / plug-in hybrids: Hybrids are vehicles that combine an internal combustion engine (ICE) with an electric motor to convert the vehicles kinetic energy to electric energy to charge a battery and/or use their ICE to generate electricity by spinning an electric generator. Plug-in hybrids are similar to hybrid cars but have a larger battery capacity which gives them the possibility to charge the battery from the grid and drive typically 50 km on electricity only. Plug-in hybrids are expected to be a bridging technology to pure electric vehicles.
BEV: A car that can drive on electricity only.
Other is defined as all other car technologies falling outside of the main four categories. Some countries have a significant number of cars that can run on other fuels than gasoline, diesel or electricity. In Brazil, flex fuel vehicles (can drive on both gasoline and ethanol) make up more than 90% of total 3 million cars sold (2013). Worldwide, there were 24 million CNG (compressed natural gas cars) on the road led by China, Iran, India, Pakistan, Argentina, Brazil and Italy (source). However, in the global context of 1.3 billion cars, they still represent a minor share.
Sales
Future growth rates for sales are based on historic growth trends and market estimates. Mature markets have stagnating growth, while car markets are expected to continue growing in non-OECD countries over the next decade before slowing. Towards 2040, global sales are predicted to decrease in line with changing mobility trends (new models for car sharing, autonomous driving, efficient public transport, etc.).
Fleet (cars on road)
The main purpose of this modeling tool is to convert estimates on future car sales to cars on road. For mature technologies like gasoline and diesel, a scrapping rate was calculated based on historic numbers and used to phase out old vehicles when incorporating sales. For emerging technologies like hybrids and battery electric vehicles, fast growing sales was not compatible with using a scrapping rate. A matrix was instead used to take older cars out of the fleet and new ones in.
Fuel efficiency
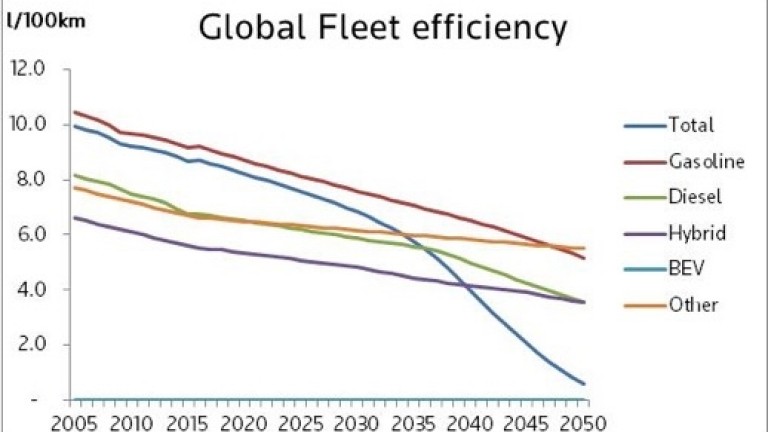
Fuel consumption per distance travelled was estimated per vehicle type through fuel efficiency assumptions in litre/100 km. These figures are for are for fossil fuels only. Historic fuel efficiency numbers from national sources were used when available; estimates were used for other regions. Fuel efficiency numbers are first set on new cars sold, while fleet efficiency is estimated to be some 10 percent higher than sales based on historic trends.
Fuel consumption for gasoline, diesel and hybrid cars is expected to improve gradually in line with improving engine technology (although expectations set back in light of diesel scandal showing limitations in terms of further efficiency gains) and national fuel efficiency standards.
Please note that Plug-in hybrids are part of the hybrid category.
Distance traveled
How far will cars travel on average per year per region? Estimates are based on national data and own assumptions. Projections on how far cars will travel per year in the future depend on mobility trends and technological developments, particularly in the EV segment. One could argue that increasing use of car sharing would mean higher yearly distance travelled. Also, growing EV shares (which are cheaper to fuel and have lower maintenance cost) could lead to more km traveled on average. The counterargument would be growing number of vehicles on road leading to more congestion to a point where other transportation modes become more attractive. We assume a distance traveled between 12,000-15,000 km per year depending on region.
Energy consumption
Energy consumption per region is calculated with the following formula:
Energy consumption in million tonne oil equivalents = Conversion factor l to toe*fuel efficiency*fleet forecast*average km travelled/1000000000
Conversion factors:
| Engine Technology | Conversion Factor To TOE |
|---|---|
| Gasoline to TOE | 0.000737 |
| Diesel to TOE | 0.000885 |
| Hybrid to TOE | 0.000737 |
| BEV to TOE | 0.000737 |
| Other | 0.000920 |
Energy consumption in thousand barrels per day = (Energy consumption in million tonne oil equivalents*conversion factor (7142,86))/365
Tailpipe emissions
Tailpipe emissions per region are calculated with the following formula:
Tailpipe emissions per region= Energy consumption in thousand barrels per day*kgCO2 per liter gasoline (2.3)*litres to barrel (159)*365/1000000
Electricity demand from EVs
The electricity demand from electric vehicles is sensitive to assumptions on efficiency. How much electricity will future EVs use per distance traveled? We made three sensitivities with the following assumptions:
| Electricity Demand | Units | Value |
|---|---|---|
| El demand | KWh/km | 0.18 |
| El demand low | KWh/km | 0.14 |
| El demand high | KWh/km | 0.22 |
Rough comparisons:
Nissan Leaf: 0.18 kWh/km
Hyundai Ioniq: 0.15 kWh/km
Tesla model S: 0.22 kWh/km