
Dashboard
The Dashboard contains information about the system wide KPIs, overdue Documents and contains a set of prebuilt process reports.
note
Dashboard contains a predefined set of widgets and is not configurable.
KPIs widget
KPIs are calculated for the last 30 days. The default KPIs displayed on the Admin dashboard are the following:
- Self Serviced documents- how many documents have been executed without legal assistance (i.e. the negotiation sub-process and/or approvals were not invoked, current status of documents is Executed).
- Approvalson time - how many documents have not breached the Approval turnaround time metric.
- Negotiationson time - how many documents have not breached the Negotiation turnaround time metric.noteNegotiations KPI is not displayed if it is turned off inAdmin>Features. see Enabling negotiation and configuring its status names.
- eSignatureson time - how many documents have not breached the Signature turnaround time metric.
For more information about the time metrics. see Configuring SLA metrics for a template.

The indicator on the KPI cards indicates the system’s state regarding the associated KPI.
- Green- more than 90% of documents are self-serviced on time, or there are no documents for which SLA metrics are tracked.
- Amber- 61-89% of documents are self-serviced on time.
- Red- 0-60% of documents are self-serviced on time.
Overdue items widget
Documents that have breached SLA metrics are displayed in the Overdue Items widget. Depending on the metric type, a document is displayed on one of the following tabs:
- Approvals- contains the list of overdue Documents, for which the Approval Turnaround Time metric has been breached
- Negotiation- contains the list of overdue Documents, for which the Negotiation Turnaround Time metric has been breachednoteNegotiation tab is not displayed if Negotiation is turned off inAdmin>Features(see Enabling negotiation and configuring its status names).
- eSignature- contains the list of overdue Documents, for which the Signature Turnaround Time metric has been breached
For more information about the configuration of the time metrics. see Configuring SLA metrics for a template.
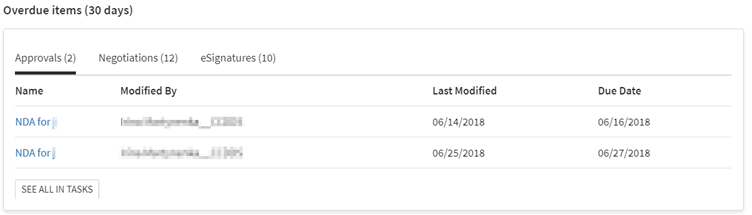
Each tab contains the five oldest overdue documents for each SLA metric. To view the full list of overdue documents, click on the "
See all in Tasks
" link (for Approvals and Negotiation) or the "See all in Documents
" link (for eSignature) The list of the overdue documents will be presented in a new browser tab.Recent actions widget
The Recent actions widget contains statistics about the documents, templates, and users that have been created, uploaded, or added during the last 30 days.
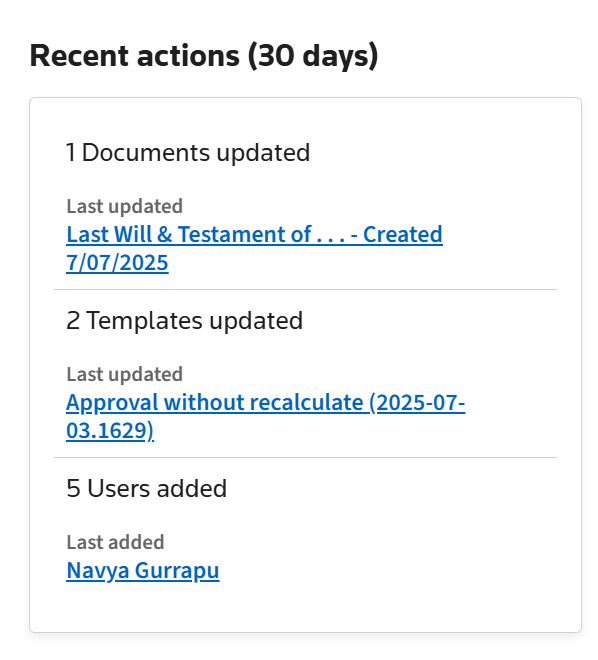
The widget also allows you to add a new document, upload a new template or invite a new user.
- Click+ Documentto add a new Document.
- Click+ Templateto upload a new template.
- Click+ Team memberto invite a new user.
Reporting widget
The dashboard contains four reporting widgets that allow you to view the corresponding prebuilt process report. All reports on the dashboard are built for the last 7 day period.
- Distribution of Documents by Status- this widget shows the status changes of documents created within the last 7 days. see Distribution reports for more information about the Distribution of Documents by Status report).
- Documents Created by User- this widget shows the top 7 users who have created the highest number of documents during the last 7 days (see Point in time reports for more information about the Total Documents Created by User report).
- Current Status of All Documents- this widget shows the number of documents in each Contract Express status for the current date. see Point in time reports for more information about the Total Documents by Status report).
- Template Popularity- this widget shows the most popular templates that have been used within the last 7 days along with how many documents have been created for each template within the last 7 days. see Point in time reportsfor more information about the Total Documents Created by Template report).
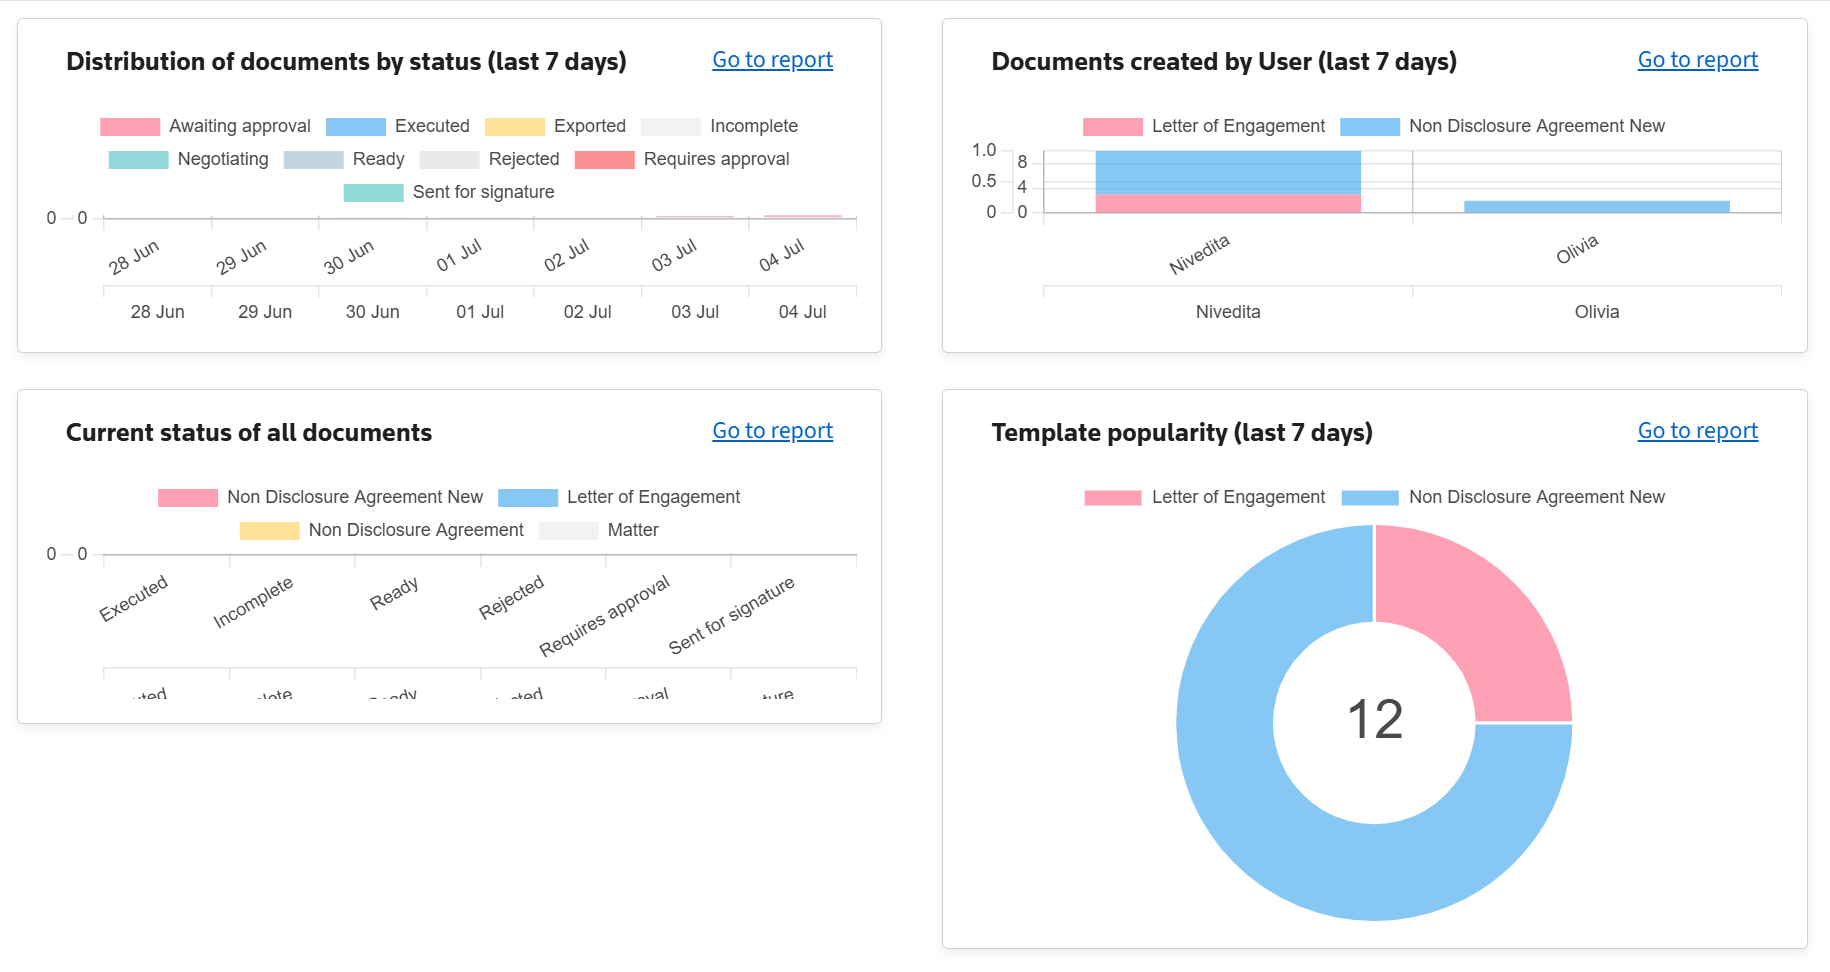
You can view each completed report by clicking on the
Go to Report
link. As a result, the Reports
tab will be displayed, where you can view the report and change its input parameters, if required. To get back to the dashboard, click on the Dashboard
tab at the top of the page.