
Law firm profits just posted their strongest growth since 2021, but that growth increasingly rests on a structural shift in who does the work as firms are leaning more than ever on associates and non-equity partners and less on equity partners, according to our research
Key insights:
- Associate demand leverage just broke a 17-year record — Associate leverage hit 1.55 in Q4 2025 — surpassing even the peak reached during the 2008 financial crisis, but this time it wasn't driven by layoffs.
- Non-equity partners never stop climbing — While associate leverage rises and falls with the economic cycle, non-equity partner leverage has grown almost every year since 2009 — through crises, booms, and pandemics alike.
- Two trends are converging for the first time — For the first time in 20 years, associate and non-equity partner leverage are rising together, after moving independently or even in opposition.
The Thomson Reuters Institute’s Law Firm Financial Index (LFFI) for the second quarter of 2026 signaled a notable acceleration in law firms’ financial strength despite increasingly challenging conditions. Yet, as demand grows healthily for the average firm, that growth is not distributed evenly across titles. Associates and non-equity partners — the lawyer full-time equivalents (FTEs) that carry most of the demand load for law firms — posted growth above 4% for both titles in the second quarter, while the remaining titles actually saw contractions in demand growth.
That contrast points to a metric that has been somewhat overlooked but is definately worth dusting off.
The value of leverage
Leverage within a law firm is the ratio of the number of FTEs who are not equity partners, divided by the number of equity partners. Similarly, demand leverage is the ratio of hours worked by FTE’s who are not equity partners divided by the hours that equity partners work themselves. To make this clearer, picture a construction crew, and determine the ratio of hours worked by the crew to the hours the site manager personally spends on hands-on labor. A high-leverage crew runs mostly on crew hours while the manager focuses on coordinating logistics, client communication, and planning. Low leverage means the manager is still doing much of the physical work personally.
Past leverage records were driven by layoffs (such as in 2008) or by temporary demand shocks (as in 2021). However, what is going on now is neither, which is what makes it worth understanding before deciding whether it's a trend that firms can continue to rely upon.
First, it’s important to understand that this ratio has been climbing steadily for the past two years across the average law firm, reaching its highest point of 1.55 in Q4 2025, meaning that FTEs who were not equity partners worked 1.55 hours for each 1 hour worked by equity partners.
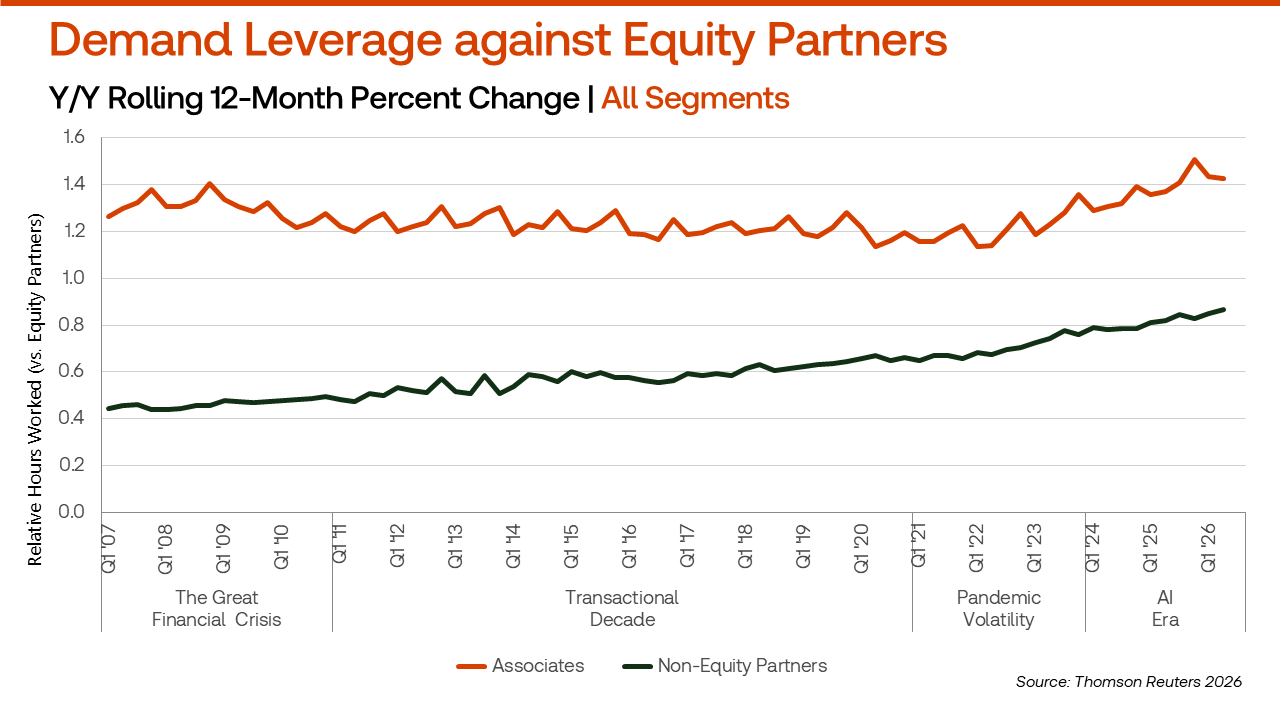
The chart above shows demand leverage for associates relative to equity partners and demand leverage for non-equity partners relative to equity partners.
During the period marked as the Great Financial Crisis, associate demand leverage reached its first historic peak of 1.44 non-equity partner hours for every equity partner hour. In the last quarter of 2008, following a flood of layoffs that occurred during the crisis, there were fewer associates, which meant the remaining ones absorbed a greater relative workload.
At the same time, a seasonal trend repeats throughout the time series: Associate demand leverage rises and falls in a predictable pattern within each calendar year. First quarters tend to post the weakest leverage of the year, often because of the natural slowdown in January most firms experience. The third and fourth quarters, on the other hand, usually see an upturn, as ongoing deals and litigation are in full swing and there is added urgency to close transactions before the end of the year.
During this same period, however, non-equity partner leverage was about one-third of the size of associate leverage, and remained nearly flat throughout the crisis at an average of 0.50. This means that during the crisis, non-equity partners worked roughly half the relative hours of an equity partner, and that proportion stayed constant throughout. This can be explained by the fact that, 20 years ago, the non-equity partner title likely represented a small category within firms' FTEs, functioning more as a transitory step on the way to an equity partnership rather than the large structural layer — and one that essentially operates as a leverage tool in its own right — that it has become today.
What’s behind shifts in leverage?
The periods marked in the chart each illustrate a different piece of the puzzle, showing whether leverage moved because firms were cutting staff, adding staff, or something else. And this context matters in determining whether Q2 2026’s record is business as usual or a genuine shift. For example, in the Transactional Decade, everything seems to stabilize. Associate leverage holds at an 1.26 average and continues to follow the seasonal oscillations described earlier. These oscillations disappeared once the pandemic began in March 2020, which led to the nadir of associate leverage, 1.18, which driven mainly by the contraction in demand. Non-equity partner leverage shows the opposite behavior: sustained, steady growth that pushed its ratio to 0.70 in Q4 2020 — nearly 40% growth over the decade.
What demand leverage does show is that firms are increasingly structuring themselves around non-equity leverage rather than treating those FTEs as a temporary response to demand.
And this is when Pandemic Volatility period hit law firms. Demand experienced a new upturn following the 2021 economic shock, posting a 7.3% increase in Q2 2021, although this figure appears larger than it actually was, largely due to the depressed base created by the pandemic contraction. During this period, average associate leverage stood at 1.25, which can be explained by law firms responding to the demand upturn with aggressive hiring strategies, reaching their highest lawyer growth rate on record of 3.8% in Q4 2021. Associate leverage later hit 1.40 in Q4 2023, its highest value since 2008. Meanwhile, non-equity partner leverage continued climbing to 0.80, itself reaching new historic highs.
Finally, moving toward the AI Era, a clear trend emerges from the data. The average associate demand leverage during this period is 1.42, with a consistent 0.07 increase year over. A new historic record was broken in Q4 2025, when associate demand leverage reached 1.55 — the highest proportion on record and the largest quarter-over-quarter jump ever observed. However, this trend line wasn’t finished. In Q1 and Q2 of 2026, firms posted a 1.47 associate demand leverage ratio. If the seasonal pattern observed in previous years — in which the third and fourth quarters tend to post higher demand leverage than the first half of the year — holds true, the coming quarters could break records once again.
A similar story is unfolding in non-equity partner territory as Q2 2026 demand leverage for this group reached an unprecedented 0.91, marking the narrowest gap ever recorded between the hours worked by equity partners and non-equity partners.
The leverage lesson for law firms
These new records tell a structural story for law firms — and offer a lesson they should heed. As law firm profits posted their strongest growth, of 12.9%, since 2021, for the first time in 20 years, associate and non-equity partner demand leverage climbed together to unprecedented levels. And this was not because of layoffs, but happened while firms kept hiring. That combination is worth watching closely, although it's worth being precise about what it does and doesn't show.
Demand leverage measures how work is split among equity partners and everyone else — it isn't a direct measure of how many hours that any individual lawyer logs, thus, it can rise even while average hours per lawyer hold steady or fall. What demand leverage does show is that firms are increasingly structuring themselves around non-equity leverage rather than treating those FTEs as a temporary response to demand.
Sustained across multiple growth cycles, that reliance on non-equity FTEs becomes a business-model choice rather than a cyclical blip. And the more profits come to depend on it, the more consequential associate and non-equity partner retention, recruiting costs, and compensation expectations will become.
The open question for firms then is whether this leverage reflects genuine efficiency gains, including those from AI-assisted work, or a structural dependency that firms would struggle to unwind if retention or hiring conditions changed.
You can access the Thomson Reuters Institute’s Law Firm Financial Index (LFFI) for the second quarter of 2026 here
Follow us on social
Topics
Have questions?

