Mar 06, 2026 | AI
The Capability leap: A framework for measuring the enterprise value of AI tools

How Thomson Reuters went beyond traditional metrics to measure what AI tools like Claude, Copilot, and ChatGPT actually deliver.
Every organization adopting AI assistant tools eventually faces the same question: “Is this actually worth what we’re paying for it?” At Thomson Reuters, when we set out to evaluate the value from multiple AI tools including Anthropic’s Claude, Microsoft Copilot, and OpenAI’s ChatGPT, we quickly realized that traditional metrics like time saved and adoption rates weren’t telling the full story. When one person uses AI to summarize meeting notes, another to write complex code, and a third to analyse financial data, how do you identify value consistently across all three? So, we built a framework to using self-reported feedback on the tools to qualitatively assess what we consider a critical measure of capability and skill expansion.
The Limits of Traditional Metrics
Most enterprise AI evaluations rely on time savings, adoption rates, and task completion volumes. These are useful signals. They’re easy to track, easy to explain to finance teams, and they provide a clear baseline. But they only capture one dimension of value: efficiency. They tell you whether work is happening faster. They don’t tell you whether work is happening that couldn’t happen before.
What We Were Actually Seeing
During our evaluation, we kept encountering scenarios that didn’t fit neatly into a “time saved” box. For instance, consider three real scenarios:
- A business analyst with no coding background starts building interactive data visualizations and performing statistical analyses that would typically require a data scientist. The work gets done, the insights are valuable, but how do you measure that in “time saved”? They didn’t save time. They did something they literally couldn’t do before.
- A junior team member produces a comprehensive market analysis that, when reviewed by senior leadership, matches the quality and depth they’d expect from someone with five more years of experience. Again, time saved? Not really. The junior person still spent their time. Senior level time was still needed to guide and evaluate. But the value is that the output quality jumped significantly.
- A non-technical program manager creates automated reporting dashboards without involving the engineering team. It saved time, certainly, but the program manager didn’t. They invested time to build something that previously required specialized technical resources. The value isn’t efficiency; It’s capability and skill expansion without being gated on resources that are in high demand elsewhere.
Traditional metrics struggle with these scenarios because they’re measuring the wrong thing. They assume AI makes existing work faster. But what happens when AI makes new work possible?
This isn’t a hypothetical scenario. In our evaluation, we found that roughly 60% of reported value fell into this category, work that represented capability expansion rather than efficiency gains.
The measurement framework and the lived experience don’t align. And when frameworks don’t capture reality, organizations make suboptimal decisions. They might limit rollouts because the metrics don’t justify expansion. They might miss the highest-value use cases because those don’t show up as time savings. They might compare AI tools purely on efficiency metrics when the real differentiator is what new capabilities each tool enables.
The question became clear: how do you quantify someone doing work they couldn’t do before? How do you measure the value of a business analyst acting as a data scientist when they previously wouldn’t have had access to a data scientist?
The New Framework: Three Dimensions of Value
We developed a framework that tracks AI value across three distinct dimensions, each captured through structured questions that feel subjective but yield actionable data.
Dimension 1: Time Saved (With Better Anchoring)
We kept the traditional time savings metric, but we changed how we asked about it. Rather than asking “How much time did you save?”, we asked users to categorize the magnitude: Did this compress days into hours? Hours into minutes? Months into weeks? This gave users concrete anchors for estimation. Instead of generating vague numbers, they had to think specifically about the magnitude of change. Did this compress a multi-day project into hours? Or did it shave minutes off an hourly task
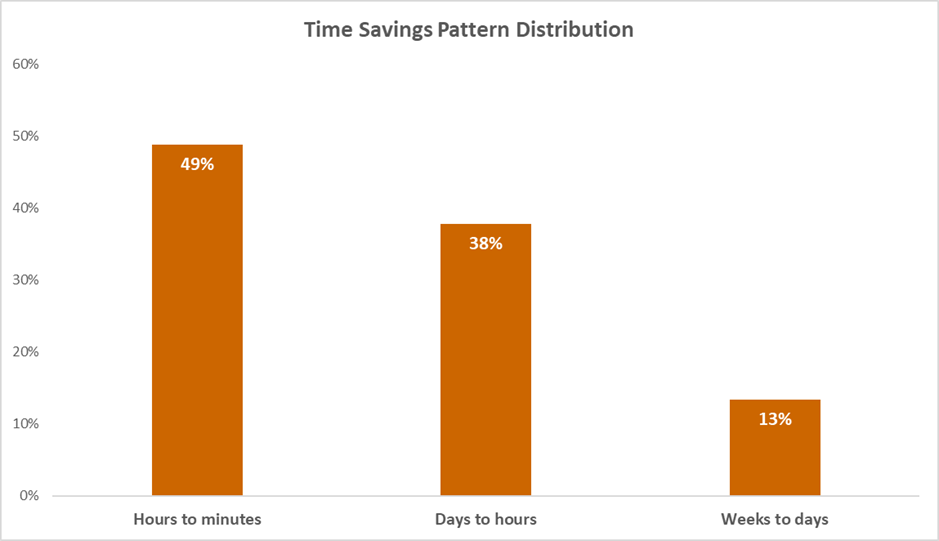
Figure 1: Across all evaluated use cases, “hours to minutes” was the most reported time saving pattern (49%), followed by “days to hours” (38%) and “weeks to days” (13%).
Dimension 2: Time Multiplier (Volume Capacity)
We asked: “Can you now handle more work volume?” with concrete ranges: slightly more (1–2x), moderately more (2x+), or significantly more (10x+). This captures something time savings misses entirely. A team handling 2x the case volume hasn’t saved time per case they expanded capacity within their team.
Notice what we didn’t ask: “How many more tasks can you complete?” That would require users to count and estimate precisely, leading to unreliable data. Instead, we asked them to bucket their experience into ranges.
A user might not know exactly whether they went from 5 cases to 12 cases per day, but they know whether it feels like “slightly more” or “significantly more.” The categories gave them language to express magnitude without requiring precision they couldn’t provide.
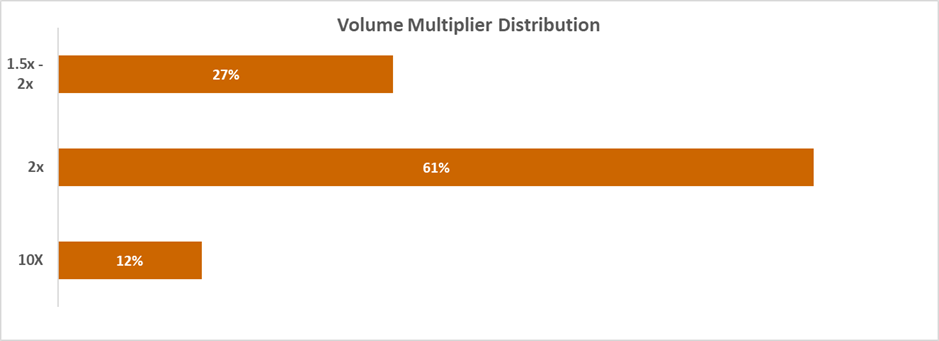
Figure 2: Of all use cases evaluated, 61% reported a 2x volume increase, 27% reported 1.5x–2x, and 12% reported a 10x increase.
Dimension 3: Skill Multiplier (Capability Expansion)
The third dimension measured whether users could perform work beyond their formal skill sets.
We asked: “Did this tool enable you to produce work at a higher expertise level than you normally operate at?” Then more specifically: “Did the tool enable you to benefit from skills you don’t have?”
When a business analyst reports using AI to perform statistical analysis, data visualisation, and predictive modelling, that’s work that would typically require a data scientist. We don’t count that as “time saved.” We classify it as data science work being performed that wouldn’t otherwise have happened. When a junior analyst produces strategic recommendations that match senior-level quality, we track that as senior analyst work being delivered that would have otherwise have not.
On a per use case level, this allows us to track that work was done when users were themselves performing work aligned to data scientists, senior analysts, technical writers, and other specialist roles. This data can then be translated into a picture of how much specialist-level output is being generated that would otherwise be slowed down because those specialist skills are in high demand and often not available, giving leadership a clearer view of the true value AI tools are delivering beyond efficiency.
This shifts the conversation. Specialist-level output is being delivered without being bottlenecked by the availability of specialist-level roles. Organisations can tackle work that previously required needing to wait, and individuals can execute on ideas they couldn’t before.
The three dimensions work together. A single use case might show:
- 2 hours saved per week (efficiency)
- 30% capacity increase for specific workflows (throughput)
- Data science-level analysis without being constrained by those with data science expertise (capability)
Each dimension tells part of the story. Together, they capture the full value picture
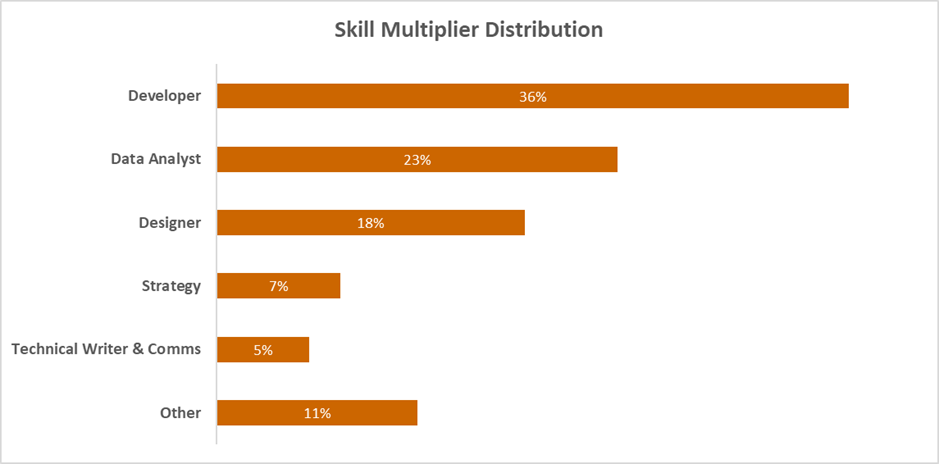
Figure 3: Developer (36%), Data Analyst (23%), and Designer (18%) dominate the distribution, accounting for over three-quarters of participants. The remaining share is split across Strategy (7%), Technical Writer & Comms (5%), and Other (11%) — the latter comprising Data Scientists, Project Managers, SMEs, and HR.
What’s Next: Measuring This at Scale
This framework was built from structured surveys and manual aggregation. The next frontier is measuring these dimensions continuously and at scale by streamlining use of this self-reported data. We see several directions:
First, integrating capability analysis into existing workflow tools, so that when someone uses AI to perform work outside their formal skill set, we can more robustly capture new adoption patterns.
Second, as the nature of individual roles changes, we expect to see the boundaries between teams shift too. New roles will emerge and there will be greater bridging between teams. Tracking how these dynamics evolve over time will be key to understanding AI’s longer-term impact on organisational structure.
Third, using the framework to inform procurement and expansion decisions in real time. Rather than waiting for quarterly reviews, organizations should be able to see which tools are driving capability expansion in which teams and allocate investment accordingly.
The question is shifting from “Is AI saving us time?” to “What can our organisation do now that it couldn’t before?” It begins to narrow the gap between adoption and value. We believe the three-dimensional framework offers a more honest and more compelling answer to the ROI question. And as AI tools continue to evolve, the organisations that measure value correctly will be the ones that invest wisely.