
“If you give me a lever and a place to stand, I can move the world.”
— Archimedes (paraphrased)
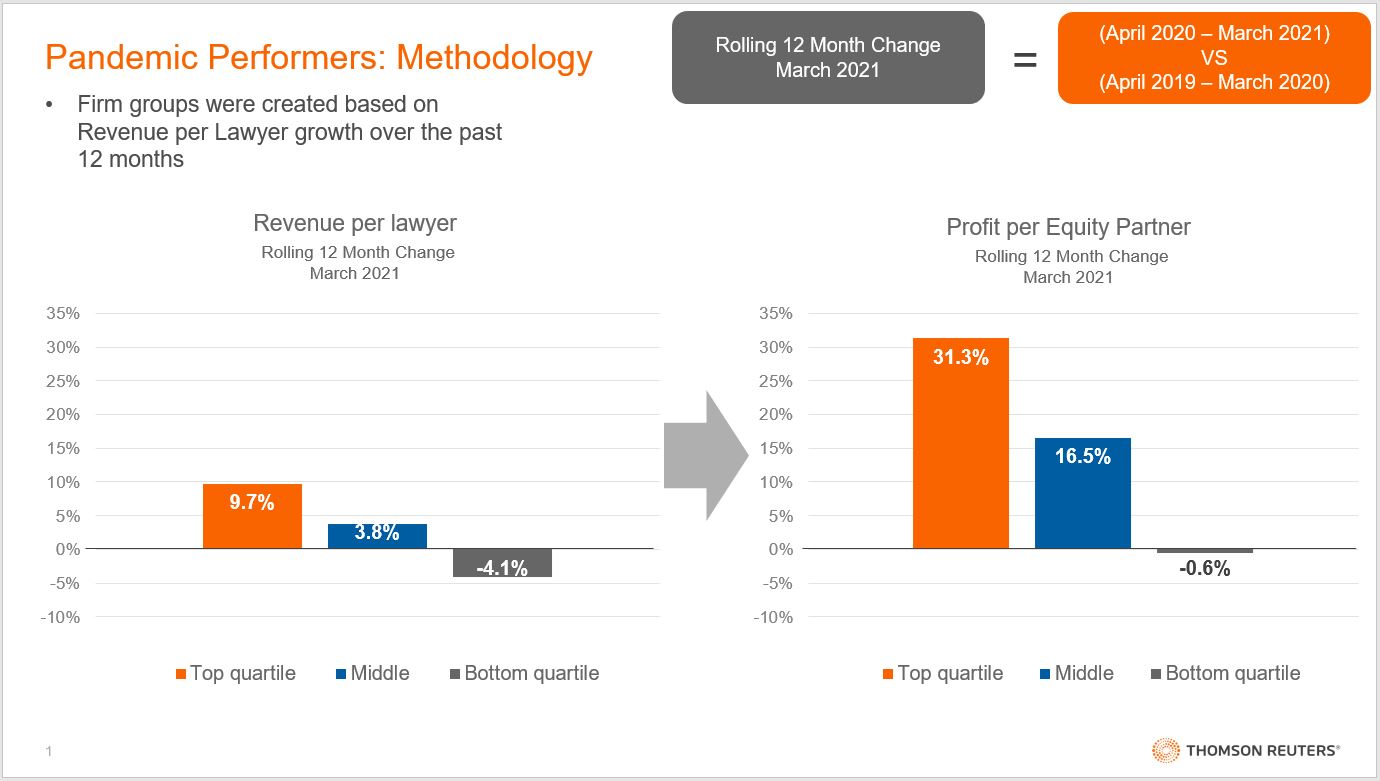
The recent 2021 Pandemic Performers report released by the Thomson Reuters Institute in June analyzed how some law firms used the challenges of the pandemic as an opportunity to grow even as other firms struggled. The report ranked law firms based on their revenue per lawyer (RPL) growth during the 12 months following March 2020 (the beginning of the global pandemic and accompanying lockdowns), and then categorized the top 25% of firms in terms of RPL growth as top-quartile firms, or our “pandemic performers.”
From there, the report sought to answer a question: What made these firms more successful than others?
When the report was published, many of its findings were focused on revenue growth and as such, a few pieces of research that didn’t fit into that conversation were left on the cutting room floor. Now with this article, their day in the spotlight has arrived.
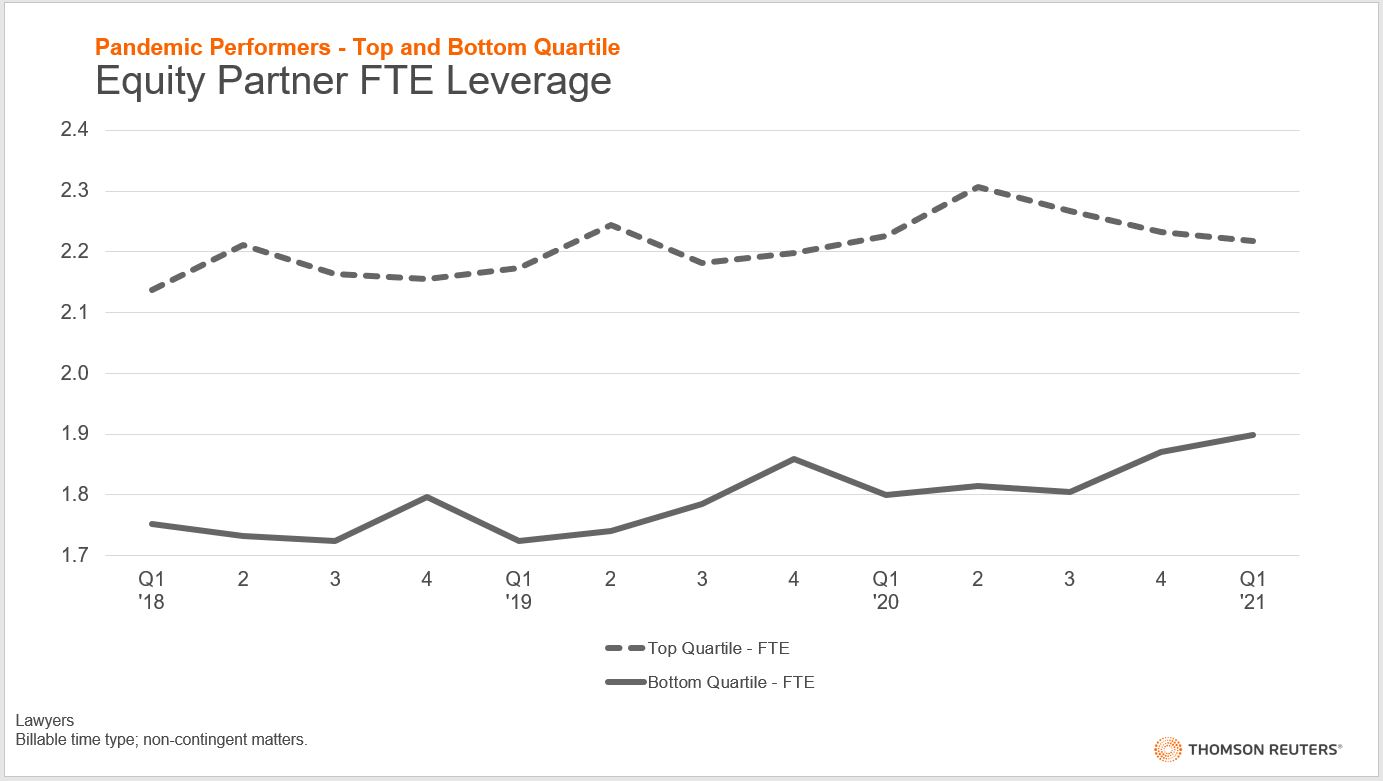
Leverage has long been a metric to which CFOs and COOs pay close attention. For our purposes, we will define leverage as the ratio of the number of all lawyer full-time equivalents (FTEs) who are not equity partners, divided by the number of equity partners. The above chart shows the leverage for both top-quartile firms and bottom-quartile firms. Already, we can see that top-performing law firms had significantly higher leverage than lesser performers. We also see that over the same time period, top-quartile firms grew slower than their bottom-quartile counterparts in both a percentage and absolute sense.
At first glance, lower quartile firms appear to be catching up; yet this is not entirely true — and to see this, we must add a second metric.
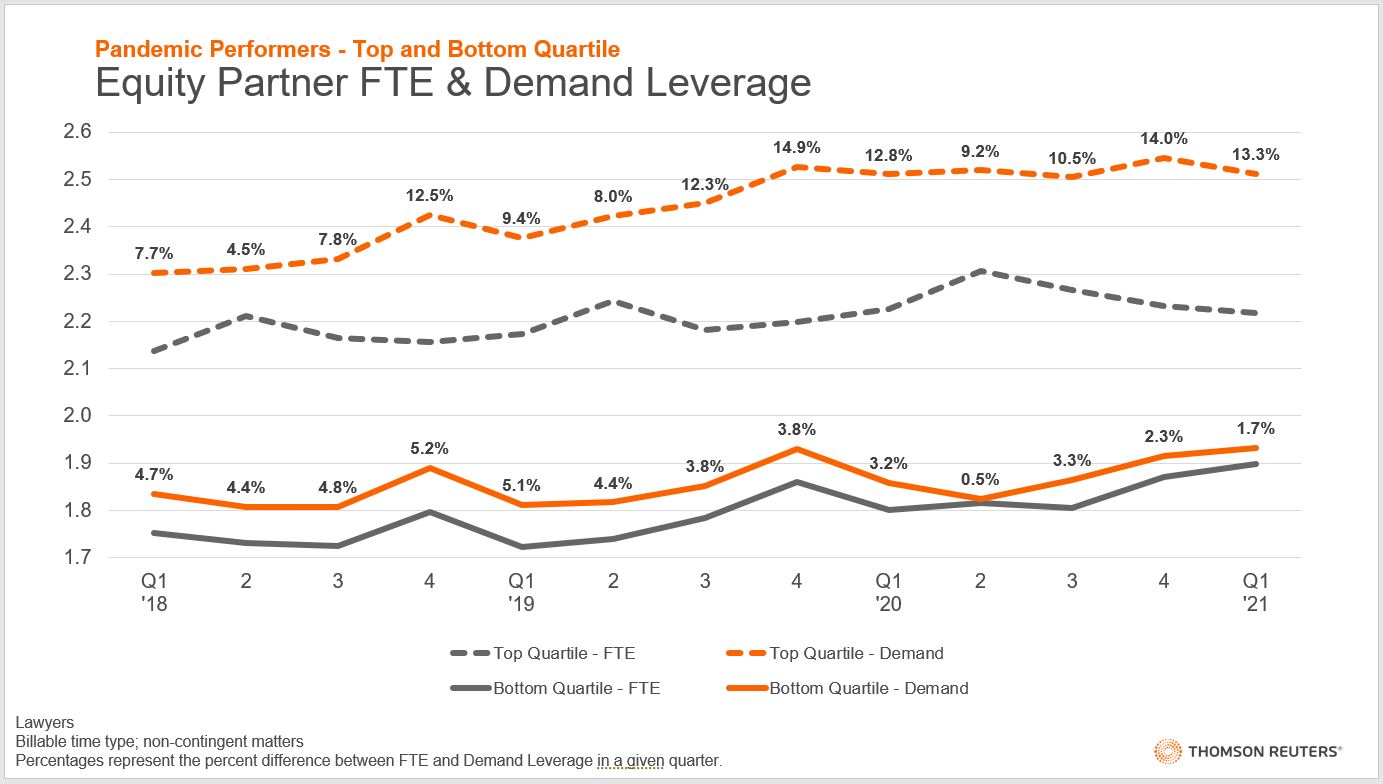
Demand leverage is a variation on FTE leverage. Rather than a simple headcount comparison, demand leverage uses the number of hours worked by each classification. Demand leverage typically exceeds FTE leverage, partly because non-partners and associates typically work more hours in order to rise through the ranks. The interesting aspect is in how the distance between FTE and demand leverage varies between our firms. Top-quartile firms grew the gap, with their demand leverage starting at 7.7% in Q1 of 2018 and reaching 13.3% in Q1 of 2021. Bottom-quartile firms on the other hand saw their gap shrink, especially during the pandemic.
What makes this gap between FTE and demand leverage so important is that it correlates heavily with profit margin. While bottom-quartile firms appear to be increasing their FTE leverage, their relative decline in demand leverage has weighed them down. The top-quartile firms, in contrast, have seen their gap between those metrics grow substantially over the last few years. At first glimpse, as we stated earlier, the data seems to imply that bottom-quartile firms are making progress, however, that doesn’t hold up to closer inspection.
Yet this is not the end of our story. This graphic has another tale to tell.
There is a seasonal trend buried in the illustration. For bottom-quartile firms there has been a distinct jump in both FTE leverage and demand leverage in the fourth quarter of every year. Top-performing firms, on the other hand, have a much more complex pattern. Top-quartile firms grew FTE leverage in Q2, but they did not see the corresponding demand leverage increase during the quarter in which they hired these new lawyers. Rather, that jump in demand leverage remains in Q4 but is magnified, with the gap between metrics growing over time. Even during the pandemic, this pattern continued.

There are a few theories which could explain this altered pattern. The first theory is that top-performing firms may have been dealt a lucky hand with their primary practice (corporate work) growing substantially during the pandemic. The typical U.S. corporation requires extensive work in the fourth quarter of each year to finish up fiscal year business so that results can be announced in the beginning months of the new year.
This brings us back to the question of why top-quartile firms hire new lawyers in Q2 rather than Q4. Top-quartile firms know that Q4 is the busiest time of the year and, rather than rushing to hire lawyers and putting them to work, they are taking their time in the selection process. These firms hire the best candidates in Q2, giving themselves six months to prepare these new hires. These new lawyers then are better positioned to provide additional value to the firm, increasing demand leverage relative to FTE leverage and thus, improving profit margins. It’s a theory analogous to the tortoise and the hare, with the bottom-quartile firms (the hare) rushing to maximize their new lawyers immediately while top-quartile firms (the tortoise) take an initially slower posture that they anticipate will result in greater results further down the road.
An alternate theory, of course, is that the larger firms which make up much of the top-quartile are the most likely to have more competitive and larger summer associate programs. As such, these firms bring these new lawyers on the books earlier but because of their summer associate status the top firms are unable to utilize them as quickly as bottom-quartile firms.
The ultimate takeaway from this analysis is that the top firms are those that not only apply leverage but instead know how to position that leverage for optimal return. For many partners, their top responsibility is to bring in work for their firm. This analysis showcases that the top-performing law firms charge their modern law firm partners with a second key responsibility — to develop and effectively utilize the firms’ junior lawyers.
To horribly paraphrase Archimedes: “If you have enough leverage and know where to place it, you can lift your law firm to another level.”
This article is a follow up to Thomson Reuters Institute’s previously published 2021 Pandemic Performers report, which is still available for download.