
As concerns around corporations' supply chains grow in importance to many stakeholders, transparency around Scope 3 emissions also has become a newly critical issue
Supply chain transparency, mostly concerning human rights, has been a critical issue for corporate stakeholders, employees, and consumers for decades. Now, the push for transparency in corporations’ supply chains has gained steam over the last five years with increased concerns around climate change, the environment, and the rise in importance of environmental, social & governance (ESG) issues.
Potential regulatory requirements around Scope 3 greenhouse gas (GHG) emissions, which often represent between 80% to 95% of an organization’s corporate carbon footprint for companies in such industries as consumer packaged goods, electronics, packaging materials, and chemicals, are a current area of particular interest.
The biggest challenges for companies in accurately reporting their Scope 3 emissions are two-fold, according to Mark Evans, Director of Business Development and Sustainability Consulting at Sphera, an ESG solutions software, consulting and data firm. These two challenges to accurate reporting involve: i) determining the most valuable method for calculating GHG emissions emitted from upstream value chains or as defined by the GHG Protocol Scope 3-Category 1 (Purchased goods and services); and ii) identifying how to actually gather this data, whether it be from within the organization itself, its suppliers, third-party databases or elsewhere.
Evans, whose team specializes in helping corporations with complex supply chains — those with hundreds or even thousands of suppliers — calculate their Scope 3 GHG inventory, indicates that there are three main ways companies approach this challenge.
1. Spend data
The most common method of calculating GHG emissions is using spend-based data. Typically, companies determine their level of emissions by using an online calculator that estimates their carbon footprint based on procurement spending.
2. Supplier surveys
In this common approach, companies estimate their emissions by sending questionnaires to their suppliers and vendors about their own GHG emission data and then collecting that data throughout their supply chain.
3. Product life-cycle assessment data
This third way, life-cycle assessment (LCA), is becoming more mainstream as requirements for more precise data develop. LCA is a methodology for assessing environmental impacts throughout the lifecycle of commercial products, processes, or services, by quantifying the amount of energy, materials, and waste discharge. Further, these data sets are governed by ISO 14044 and ISO 14067, globally recognized standards that outline requirements and guidelines for how to conduct product life cycle assessments.
These datasets provide granular GHG emissions data for understanding the cradle-to-gate impacts of a product or process, from extraction of raw materials through processing and production to distribution. LCA data can also be used for Scope 3-Category 11 (Use of sold products), which is the major emissions source-point for the automotive and industrial equipment industries, which see 85% of their Scope 3 emissions in the use-phase of their products.
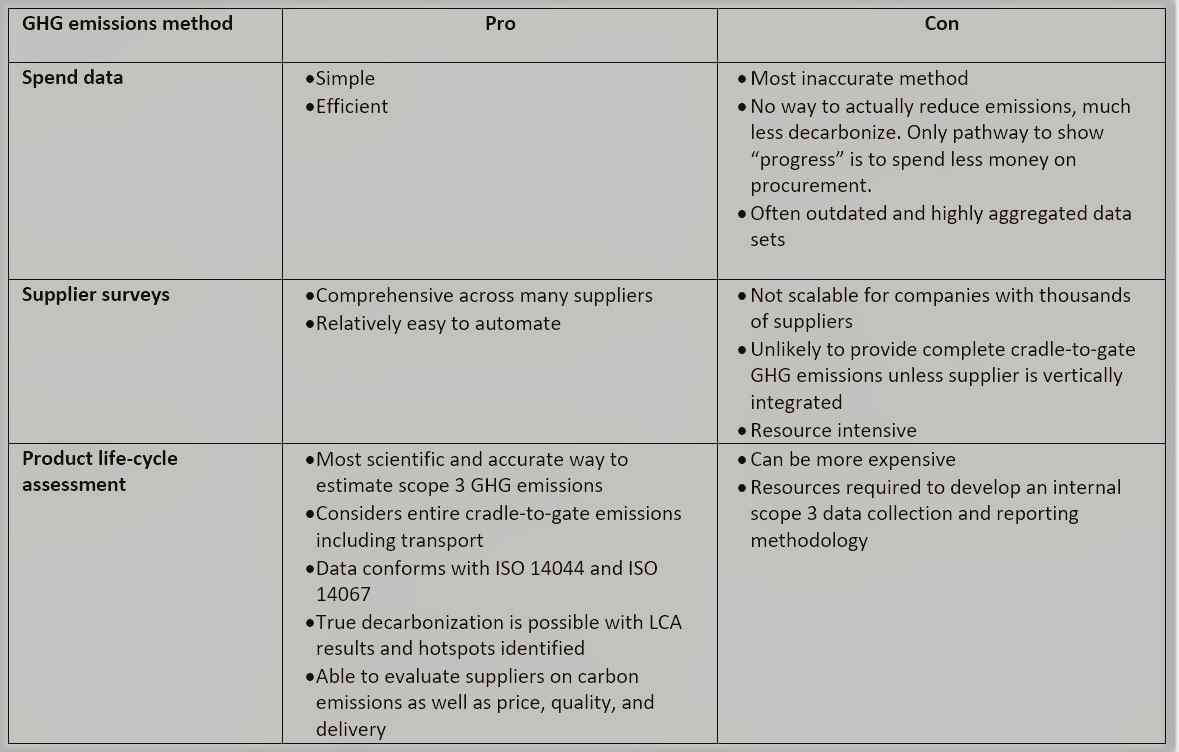
As the above chart shows, there are pros and cons of each of the main methods for collecting emissions data. For example, companies have seen reductions of up to 90% in their Scope 3-Category 1 GHG emissions after moving away from using the spend based-methodology to the product life-cycle assessment methods, largely due to the use of far better data granularity.
As far as the use of supplier surveys go, companies are dependent on the data supplied to them by their vendors. For example, if a company makes an emissions data request of its T-shirt manufacturer in Indonesia, asking for the GHG emissions generated from within its four walls, any data received is likely to be incomplete and not representative of the actual cradle-to-gate GHG emissions from that supply chain. That is because, essentially, energy consumption at that sewing facility is limited to operating sewing machines and running UV lights. What will not be captured are the upstream impacts from the textile mill, the ginnery, the cotton farm, international transportation and more. As such, GHG emissions associated with this Tier 1 supplier won’t represent a significant piece of the broader emissions picture.
Conversely, an LCA dataset for a cotton T-shirt definitionally captures the impact of each of these production steps from the cotton farm itself and can be adjusted to reflect particular characteristics of a company’s value chain. In addition, LCA data can be used to explore decarbonization pathways through modeling the reduced impacts of bio-based materials, more recycled content, and different production locations.
On the horizon
Improved methods for tracking Scope 3 emissions data will enhance transparency, auditability, and traceability for GHG reporting. This in turn will enable the digitization of carbon footprints versus the most current practice of using a manual approach with data collected in Excel sheets.
These evolving data capture methodologies eventually will enable companies to produce efficient, granular product-level and Scope 3 reporting at scale both internally to management and outwardly to consumers, regulatory agencies, and industry associations.
For more information about how corporations are implementing and executing their ESG initiatives, download our latest white paper, Building a Foundation for ESG here.